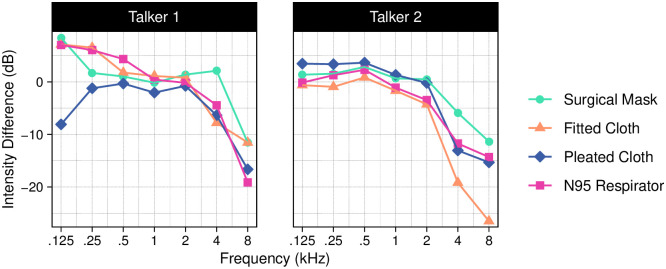
Fig 3. Difference in band energy between the no-mask condition and each of the four face mask conditions for sound frequencies in octave-scale bands centered at 125, 250, 500, 1000, 2000, 4000, and 8000 Hz.
The acoustic effects of the masks depended on both mask type and frequency. Generally, there were small differences compared to the no-mask condition at lower frequencies and a 5–25 dB decrease in intensity at higher frequencies.

