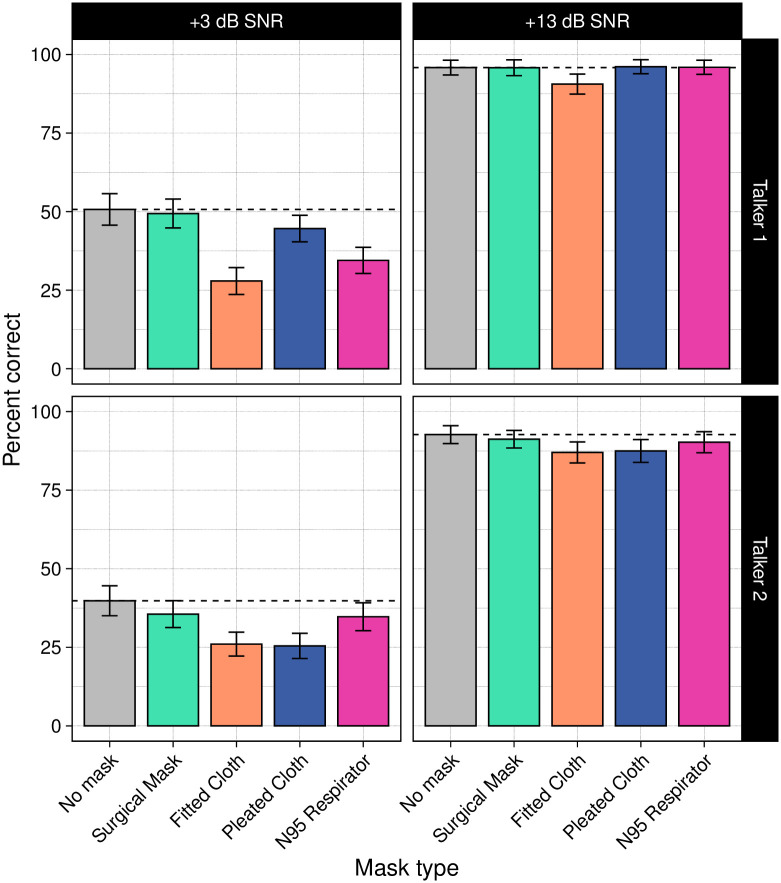
Fig 4. Mean percentage of words correctly recognized in the sentences as a function of mask type, signal-to-noise ratio (SNR), and talker.
Horizontal dashed lines represent the mean of the no-mask condition in each panel. Overall, listeners were much more accurate at the high SNR (+13 dB) than at the low SNR (+3 dB), and they were more accurate for Talker 1 than for Talker 2. At the high SNR, only the fitted cloth mask led to poorer performance compared with the no-mask condition. At the low SNR, both cloth masks and the N95 respirator led to lower accuracy. The pleated cloth mask also caused lower accuracy for Talker 2. Errors bars represent 95% confidence intervals.

