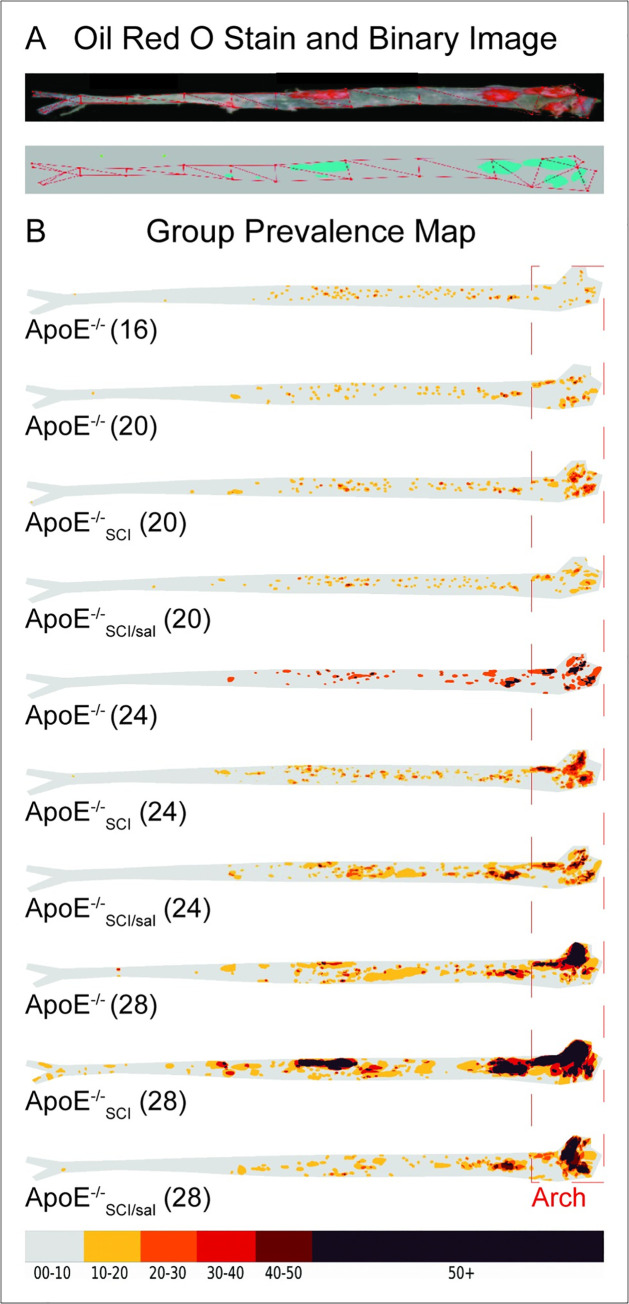
Fig 1. Oil Red O stained aorta and morphometric analysis of atherogenic lesion plaque lesion formation.
A. Oil Red O (ORO) stained aorta (top) and corresponding binary image (bottom) generated from staining threshold. B. All groups exhibit lesions which are increasingly evident across time. Red outline indicates aortic arch region where lesion area was examined and analyzed. Numbers in brackets reflect age in weeks.

