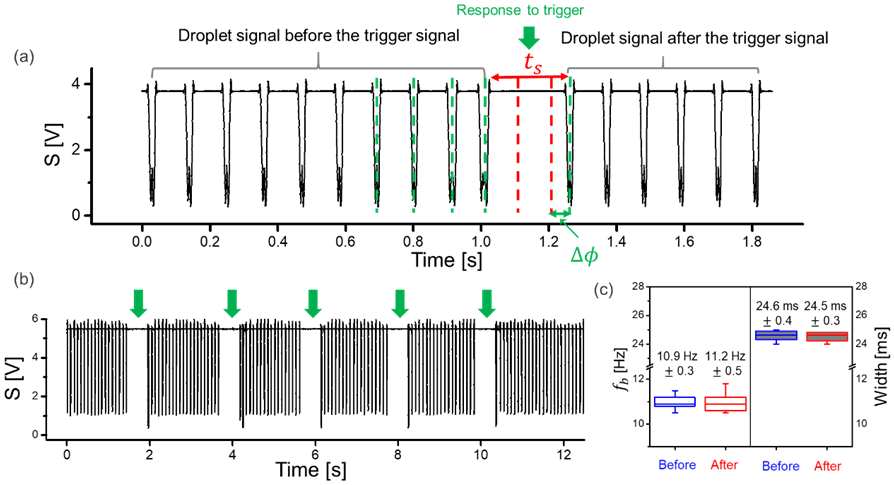
Figure 4.

(a) A trace of stable droplet generation frequency (fb) in mode 2. Upon application of an AC potential (UAC = 250 V at fu = 100 Hz, tw = 10 ms), the droplet generation is shortly interrupted (response to trigger). This leads to a Δϕ, without change in fb. The dashed red lines during ts are representative of the droplets that would have been generated at fb without a stimulus. (b) Example droplet trace showing multiple trigger signals (UAC = 250 V at fu = 100 Hz, tw,AC = 10 ms), all generating a similar response to the trigger (silent time), whereas the frequency fb* recovers to fb after each electrical trigger. The droplet signals were acquired using the droplet detector and recorded with Powerlab and Labchart (see Supplementary Information for details). (c) Analysis of the droplet frequency and width over 10 seconds before and after the trigger. The base frequency and droplet length (in time) are consistent before and after the trigger with errors. In the box plots, boxes extend from the 25th to the 75th percentiles with a line at the median. Whiskers extend to the max/min data points.
