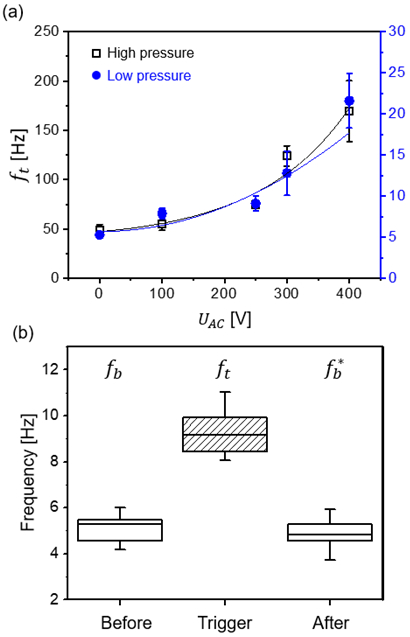
Figure 5.

(a) Dependence of the achieved droplet generation frequency (ft) on the applied AC amplitude (UAC) at fu = 100 Hz in both high-pressure (black) and low-pressure (blue) systems. The base frequency was 49.1 ± 5.7 Hz and 5.6 ± 0.3 Hz for high and low pressure, respectively. The lines represent quadratic curve fits. Error bars represent the standard deviation. Some error bars in (a) are obscured by the size of the symbol. (b) Analysis of fb 2 min before and after the trigger signal for UAC = 250 V at fu = 100 Hz, tw,AC = 1 s. Droplet generation frequencies, fb, ft and , were 5.0 ± 0.4 Hz, 9.2 ± 0.7 Hz and 4.7 ± 0.5 Hz, respectively. The droplet generation frequency is accelerated during tw,AC and fb* is similar to fb, within error margins. In the box plots, boxes extend from the 25th to the 75th percentiles with a line at the median. Whiskers extend to the max/min data points.
