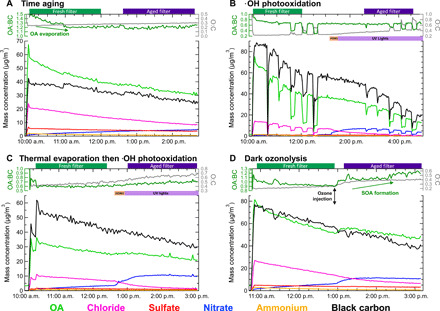
Fig. 2. Exemplary evolution of submicrometer aerosol chemical composition in the four types of simulated atmospheric aging explored.

Each panel shows SP-AMS chemical composition measured for one type of aging. Mass concentration (trace color corresponds to chemical component) in SP-mode is plotted in the lower portion; the OA:BC ratio—a measure of the gain or loss of OA versus the conserved BC tracer that only undergoes chamber wall loss—is plotted on the upper left axis. A measure of OA oxidation state, the O:C atomic ratio from EI-mode measurements, is plotted on the upper right axis. OA:BC and O:C are unreliable during the first few minutes of the experiment while the chamber is filling. Collection times of fresh and aged filters for INP analysis are shown by green and purple bars, respectively, on the top of each panel. (A) Cutgrass time aging experiment with considerable evaporation of OA observed in the OA:BC ratio. (B) Sawgrass photooxidation experiment; HONO injection is shown by the orange bar and UV illumination by the purple bar. Sudden decreasing mass concentration and increasing O:C occurred when the aerosol particles were passed through a heated thermodenuder before entering the SP-AMS. (C) Sawgrass experiment where the BBA was subjected to thermal desorption at 250°C before injection into chamber. HONO injection is shown by the orange bar, and UV illumination is shown by the purple bar. (D) Cutgrass dark ozonolysis experiment, with 350 ppb of ozone injected at the labeled time. The formation of SOA is indicated through the increase in OA:BC following ozone injection.
