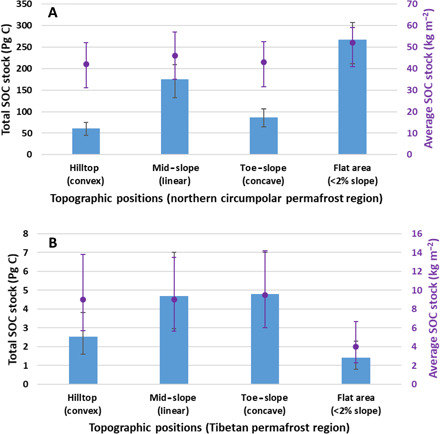
Fig. 3. Heterogeneous topographic controls on permafrost region soil organic carbon stocks.

Total SOC stocks and average SOC stocks across different topographic positions in the northern circumpolar (A) and Tibetan (B) permafrost regions. Bars are total predicted SOC stocks and circles are average SOC stocks in the 0–3 m depth interval. Error bars indicate the 95% confidence interval of the predictions.
