
Fig. 1. Precise incorporation of a high density of vacancy defects in graphene by millisecond gasification.
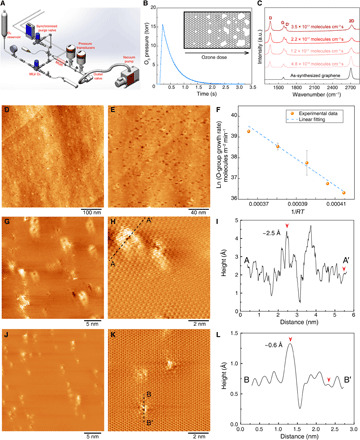
(A) Schematic of the MGR setup. (B) Profile of the O3 pulse in MGR. (C) Raman spectroscopy analysis showing the evolution of the N-SLG with increasing O3 dose. (D and E) Scanning tunneling microscopy (STM) images of N-SLG on Cu foil prepared by MGR at 250°C. The sample was annealed at 900°C before the STM imaging. (F) The temperature-dependent coverage rate of the functional oxygen groups on N-SLG fitted with linear regression. In the x axis, R refers to the universal gas constant and T refers to the functionalization temperature. (G and H) STM images of highly oriented pyrolytic graphite (HOPG) treated by MGR at 250°C. (I) The height profile of the line (AA′) in (H). The images were acquired by transferring samples to STM immediately after MGR, and no further thermal annealing was carried out. STM images of samples shown in (G and H) after annealing at 800°C inside the STM chamber (J and K). (L) The height profile of the line (BB′) in (K). a.u., arbitrary units.