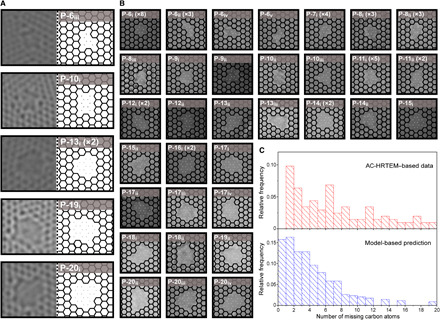
Fig. 2. AC-HRTEM–based analysis of the lattice structure of the vacancy defects incorporated in N-SLG from millisecond gasification.

(A and B) AC-HRTEM images of the vacancy defects and corresponding lattice-fitted structures (dots indicate missing carbon atoms). The repeated occurrence of each defect within the set of images is indicated inside the bracket. For example, P-13i (×2) indicates that P-13i was observed two times. (C) Top: Distribution of the number of missing carbon atoms in the vacancy defects based on the AC-HRTEM. Bottom: The predicted distribution of the missing carbon atoms using the gasification kinetics model.
