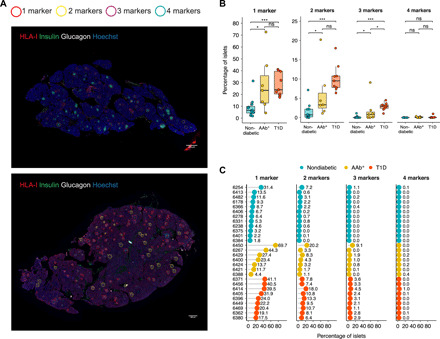
Fig. 3. IFN response markers are coexpressed in a significant number of islets in AAb+ and T1D donors.

(A) Representative immunofluorescence images of entire tissue sections from a nondiabetic (top, donor no. 6278) and a T1D donor (bottom, donor no. 6362) stained for HLA-I, insulin, glucagon, and Hoechst. Each positive islet was assigned a colored circle based on the number of expressed markers as follows: red for the expression of one marker, yellow for two markers, purple for three markers, and blue for four markers. Scale bars, 290 μm. (B) Box plots showing median and first and third quartile show the percentage of islets positive for one, two, three, or four markers for each donor group. The upper and lower whiskers extend from the hinges to the largest or lowest value no further than 1.5 times the interquartile range from the hinge. Data beyond the end of the whiskers are called outlying points. Each dot represents a donor. (C) Percentage of islets positive for one, two, three, or four markers in individual donors. *P < 0.05; ***P < 0.001; ns, not significant.
