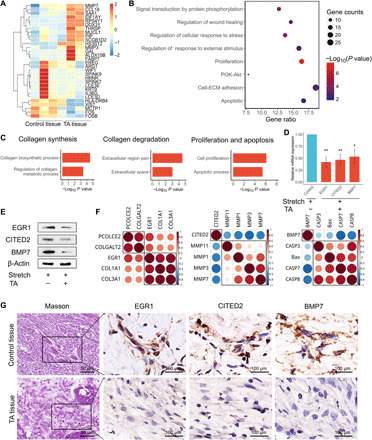
Fig. 2. Mechanosensors including EGR1, CITED2, and BMP7 participate in cellular mechanical responses.

(A) HSFBs treated with TA were seeded in chambers and subjected to mechanical stretch. Paired HSFBs in the control groups were treated with solvent and subjected to mechanical stretch. Microarray analysis (GSE151240) of differentially expressed genes was performed. Red shading indicates increased gene expression, whereas blue shading indicates decreased expression. The mRNAs that were up-regulated by at least 2-fold (red bars) or down-regulated by at least 0.5-fold (blue bars) were included in the cluster analysis. (B) The bubble chart provides an overview of the most enriched pathways ranked as the top eight altered pathways according to Cytoscape analysis. Bubble size represents the number of genes in each pathway. The bubble color indicates the P value of each pathway. PI3K, phosphatidylinositol 3-kinase. (C) GO annotation using DAVID (Database for Annotation, Visualization, and Integrated Discovery) bioinformatic classification of gene categories from fig. S3. Biological process shows the signaling pathways that were most markedly changed by TA treatment of stretched HSFBs. (D and E) qRT-PCR (D) and Western blotting (E) analyses using HSFBs undergoing stretching and/or treatment with TA. The results of qRT-PCR were normalized to glyceraldehyde-3-phosphate dehydrogenase (GAPDH) expression, and in the Western blotting analysis, β-actin was used as an internal loading control. Data are presented as means ± SD. *P < 0.05, by Student’s t test. (F) Correlation analysis of candidate genes involved in the indicated biological processes based on qRT-PCR assays of gene expression in (C). Red indicates positive correlations, and blue indicates negative correlations. The brightness is proportional to the strength of the correlation. (G) Masson’s trichrome staining for collagen using serial sections of clinical hypertrophic scar tissues before or after treatment with TA for 28 days. Immunohistochemical analysis of EGR1, CITED2, and BMP7 proteins in TA-treated hypertrophic scar tissues and paired control tissues is shown.
