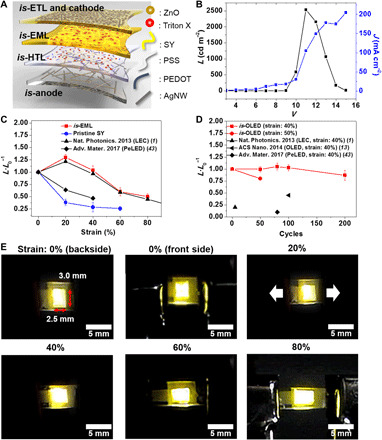
Fig. 3. Fabrication and characterization of is-OLEDs.

(A) Schematic structure of is-OLEDs fabricated in this study. (B) J-V-L curve of is-OLEDs. (C) Relative L change (L·L0−1) of is-OLEDs based on pristine SY and is-EML during the static stretching tests. (D) L·L0−1 changes of is-OLEDs during cyclic stretching tests. (E) Optical images of is-OLEDs with an original emission area of 3.0 × 2.5 mm2, operated under various strains at applied V of 9.5 V for 0, 20, and 40% strain and 9.8 V for 60 and 80% strain. All data were measured under ambient atmospheric conditions. L was measured on the basis of the emission from the cathode (front side). Photo credits (E): Jin-Hoon Kim, Yonsei University.
