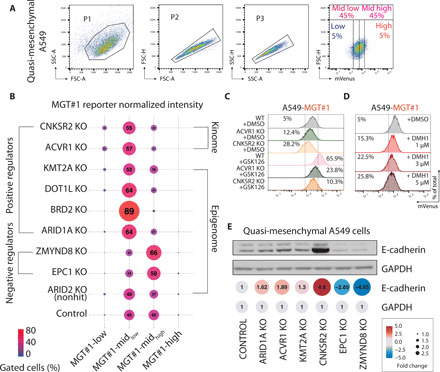
Fig. 2. Genetic loss of potential EMT regulators phenocopies CRISPRi screen.

(A) Gating strategy for assessing fluctuations in EMT by FACS analysis of MGT#1 expression. SSC-A, side scatter area; FSC-A, forward scatter area. (B) Bubble plot of the FACS analysis of MGT#1 expression in A549-MGT#1 carrying individual KO mutations. (C) FACS analysis of MGT#1 fluorescence intensity in A549-MGT#1 cells with the indicated genotypes and treatments. WT, wild type; DMSO, dimethyl sulfoxide. (D) FACS analysis of MGT#1 fluorescence intensity in A549-MGT#1 cells with the indicated treatments. (E) Immunoblot of E-cadherin expression in A549-MGT#1 carrying individual KO mutations. Quantification of normalized protein band intensity is shown.
