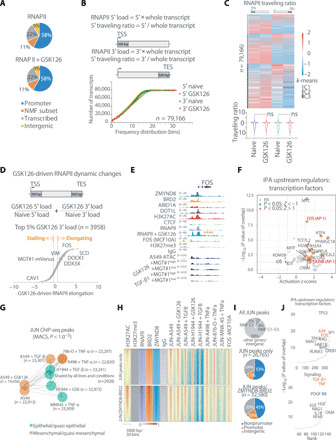
Fig. 6. Antagonistic chromatin regulators control meta-EMT activity via enhancers and promoters regulated by RNAPII elongation and converging on the AP-1 transcriptional network.

(A) Pie charts showing the genomic distribution of the RNAPII in naïve and GSK126-treated A549. The NMF signatures genes from Fig. 5A are highlighted as a subset of promoters (orange). (B) Cumulative distribution plot of the genome-wide RNAPII loading at 5′ and 3′ of each transcript, as defined above. (C) Heatmap (above) and violin plot (below) of RNAPII traveling ratio at 5′ and 3′ of each transcript for naïve and GSK126-treated cells. Clustering was performed using k-means, with k = 3, and the “ns” denotes no significance by one-way ANOVA and Sidak post hoc test. (D) Relative RNAPII traveling ratio between naïve and GSK126-treated cells on selected genes, as defined above. A ±0.5 threshold was decided on the MGT#1-mVenus reporter (more stringent), and selected examples are shown. (E) IGV view of FOS. The asterisks denote changes in elongation as determined in (D). (F) Upstream regulator analysis by IPA on the genes passing the FC in (D). The AP-1 transcription factor components are highlighted in red. (G) Giraph plot showing the distance between JUN ChIP-seq peak lists. Colors denote the known state of the cell line in which ChIP-seq was performed. (H) Heatmap of signal intensity for the indicated ChIP-seq profiles for all JUN peaks in (G). Direct overlap with genomic loci in Fig. 4A was used to partition chromatin occupancy into the indicated clusters. (I) Pie charts showing the genomic distribution of all JUN peaks in (G), above. NMF C1 genes were annotated when a JUN peak was close to the gene (−2.5 and +0.5 kb). The below charts are referred to the two clusters in (H). (J) Upstream regulator analysis by IPA on the genes annotated in (I) as direct JUN/ZMYND8-BRD2 targets.
