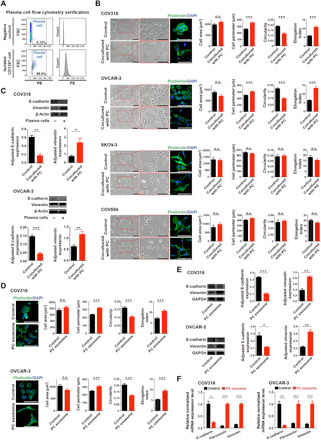
Fig. 2. Treatment of ovarian cancer cells with plasma cells induces a mesenchymal phenotype.

(A) Plasma cells that are marked by CD138 antibody were isolated from ovarian cancer patient blood by magnetic bead sorting and quantitatively verified by flow cytometry. PE, phycoerythrin; FSC, forward scatter. (B) Phase-contrast micrographs of COV318, OVCAR-3, SKOV-3, and COV504 cells treated with control or cocultured with plasma cells (PC) for 48 hours. Scale bar, 100 μm. Phalloidin staining was shown to quantify the difference between control or cocultured groups. The quantifications include cell area, perimeter, circularity, and elongation index (mean ± SEM of no less than 40 cells per group). n.s., not significant. (C) Western blotting analysis of epithelial-mesenchymal transition (EMT) markers in COV318 and OVCAR-3 cells cocultured with plasma cells compared with control for 48 hours. ImageJ software was used to quantify protein expression levels (n = 3 for each group). (D) Phalloidin staining of COV318 and OVCAR-3 cells was shown to quantify the difference between control and plasma cell exosome–treated groups for 48 hours. Scale bar, 100 μm. The quantifications include cell area, perimeter, circularity, and elongation index (mean ± SEM of no less than 40 cells per group). (E) Western blotting analysis of EMT markers in COV318 and OVCAR-3 cells treated with plasma cell exosomes compared with control for 48 hours (n = 3 for each group). ImageJ software was used to quantify protein expression levels. GAPDH, glyceraldehyde phosphate dehydrogenase. (F) mRNA levels of EMT markers in COV318 and OVCAR-3 cells treated with plasma cell exosomes compared with control for 48 hours (n = 3 for each group). In (B) to (F), statistical significance was determined by a two-tailed, unpaired Student’s t test. Data are shown as mean ± SEM. *P < 0.05; **P < 0.01; ***P < 0.001.
