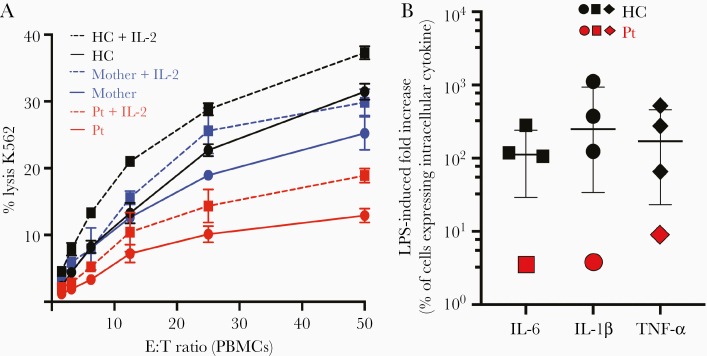
Figure 6.
A, Evaluation of natural killer cytotoxicity by a 4-hour 51Cr cytotoxicity assay in the presence (dashed line) or absence (solid line) of 1000 U/mL interleukin 2. Peripheral blood mononuclear cells from the proband (red), her mother (blue), or a healthy control (black) were used as effectors against K562 target cells at indicated ratios. Data shown from 1 biological replicate performed in triplicate; error bars indicate the standard deviation. B, Induction of intracellular cytokines upon lipopolysaccharide (LPS) stimulation in monocytes from healthy subjects (black symbols) and in the proband (red symbols) as measured by fold increase in the proportion of cells expressing intracellular cytokines compared to resting conditions. The median and interquartile range of the LPS-induced fold increase in the proportion of cells expressing intracellular interleukin 6 (squared), tumor necrosis factor–α (circles), and interleukin 1β (diamonds) for 3 different healthy controls are presented. Abbreviations: E:T, effector to target cell ratio; HC, healthy control; IL-1β, interleukin 1β; IL-2, interleukin 2; IL-6, interleukin 6; LPS, lipopolysaccharide; PBMCs, peripheral blood mononuclear cells; Pt, proband; TNF-α, tumor necrosis factor alpha.

