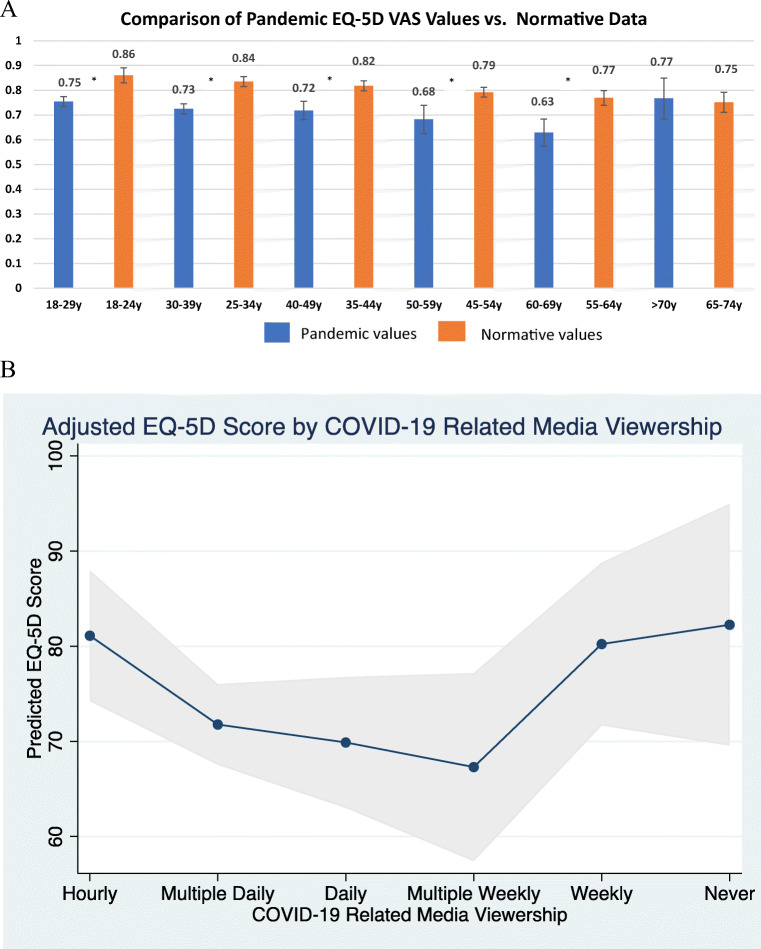
Figure 1.
EQ-5D-3L Visual Analogue Score assessed during the COVID-19 pandemic. Panel a denotes EQ-5D-VAS assessed during the pandemic compared to normative trend by age tier. Asterisks indicate values significantly lower (worse) VAS than normative data (p < 0.001). Panel b denotes a bimodal relationship between quantity of time per week spent viewing news stories regarding COVID-19 and the predicted EQ-5D-VAS value. Asterisks indicate values significantly lower (e.g., worse) VAS than baseline (p < 0.05) associated with viewing news multiple times a day, daily, and multiple times a week vs. hourly viewing.

