
Figure 1. Formation and Isolation of the Pre-Termination Complexes (PTCs).
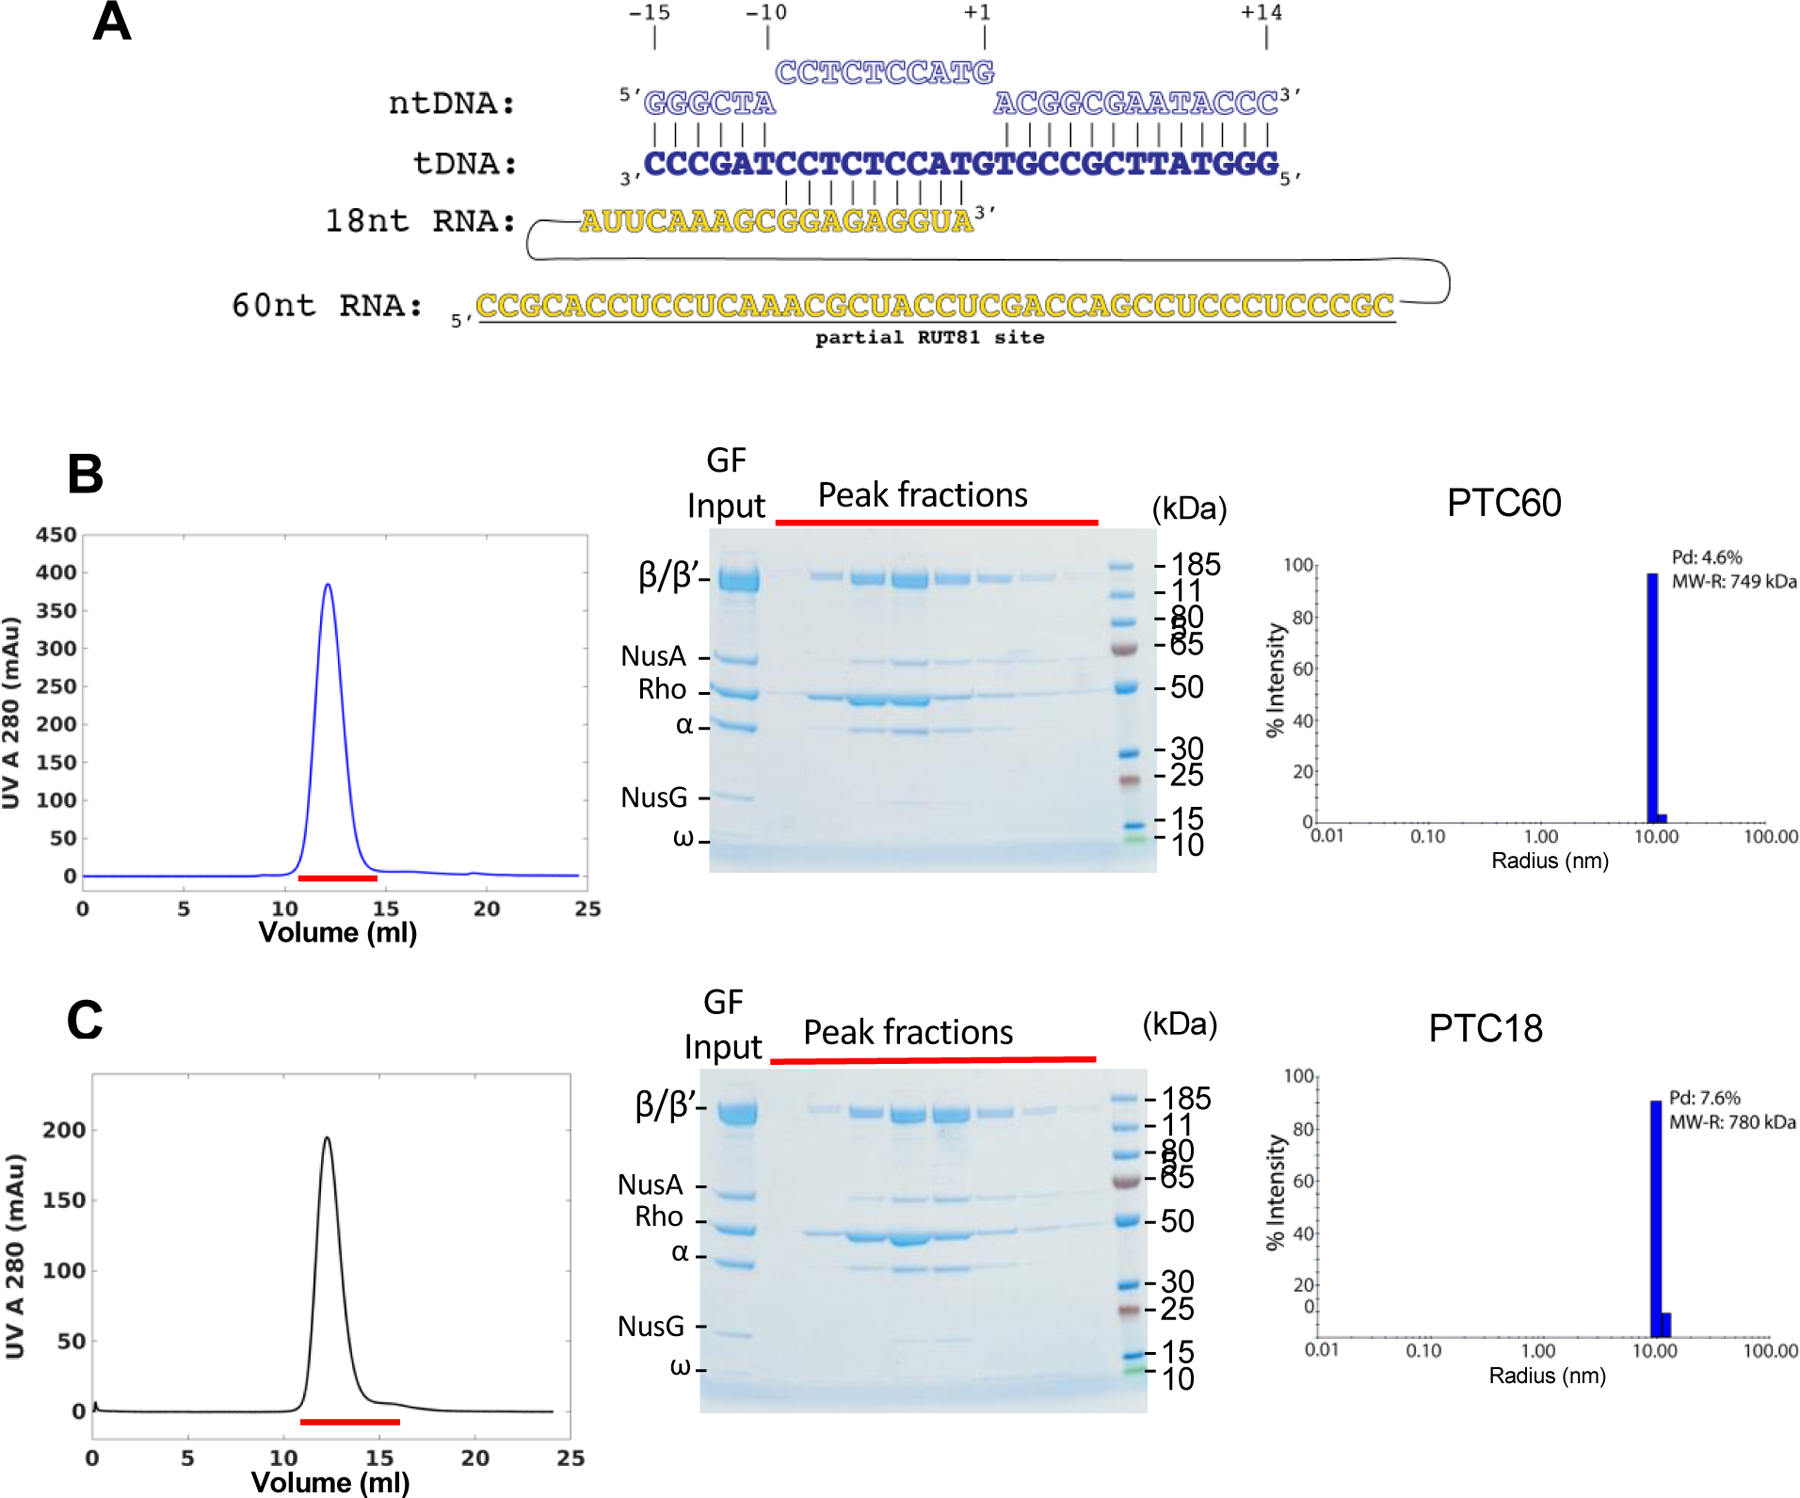
(A) Schematic of the nucleic acid scaffold used to assemble the tertiary elongation complexes (EC18 and EC60). ntDNA - nontemplate DNA strand; tDNA - template DNA strand; nt - nucleotide; partial RUT81 – the first 40 nucleotides of canonical 81-nucleotides Rho-utilization site.
(B) Size-exclusion chromatography (SEC) of PTC60 (left panel). Red line indicates the peak fractions that were analyzed by SDS-PAGE (middle panel). Right panel shows the dynamic light scattering (DLS) analysis of the peak fraction from the SEC purification of PTC60 (%Pd, the polydispersity statistics; MW-R, estimated molecular weight).
(C) SEC of PTC18 (left panel). Red line indicates the peak fractions that were analyzed by SDS-PAGE (middle panel). Right panel shows DLS of the peak fraction from the SEC purification of PTC18.