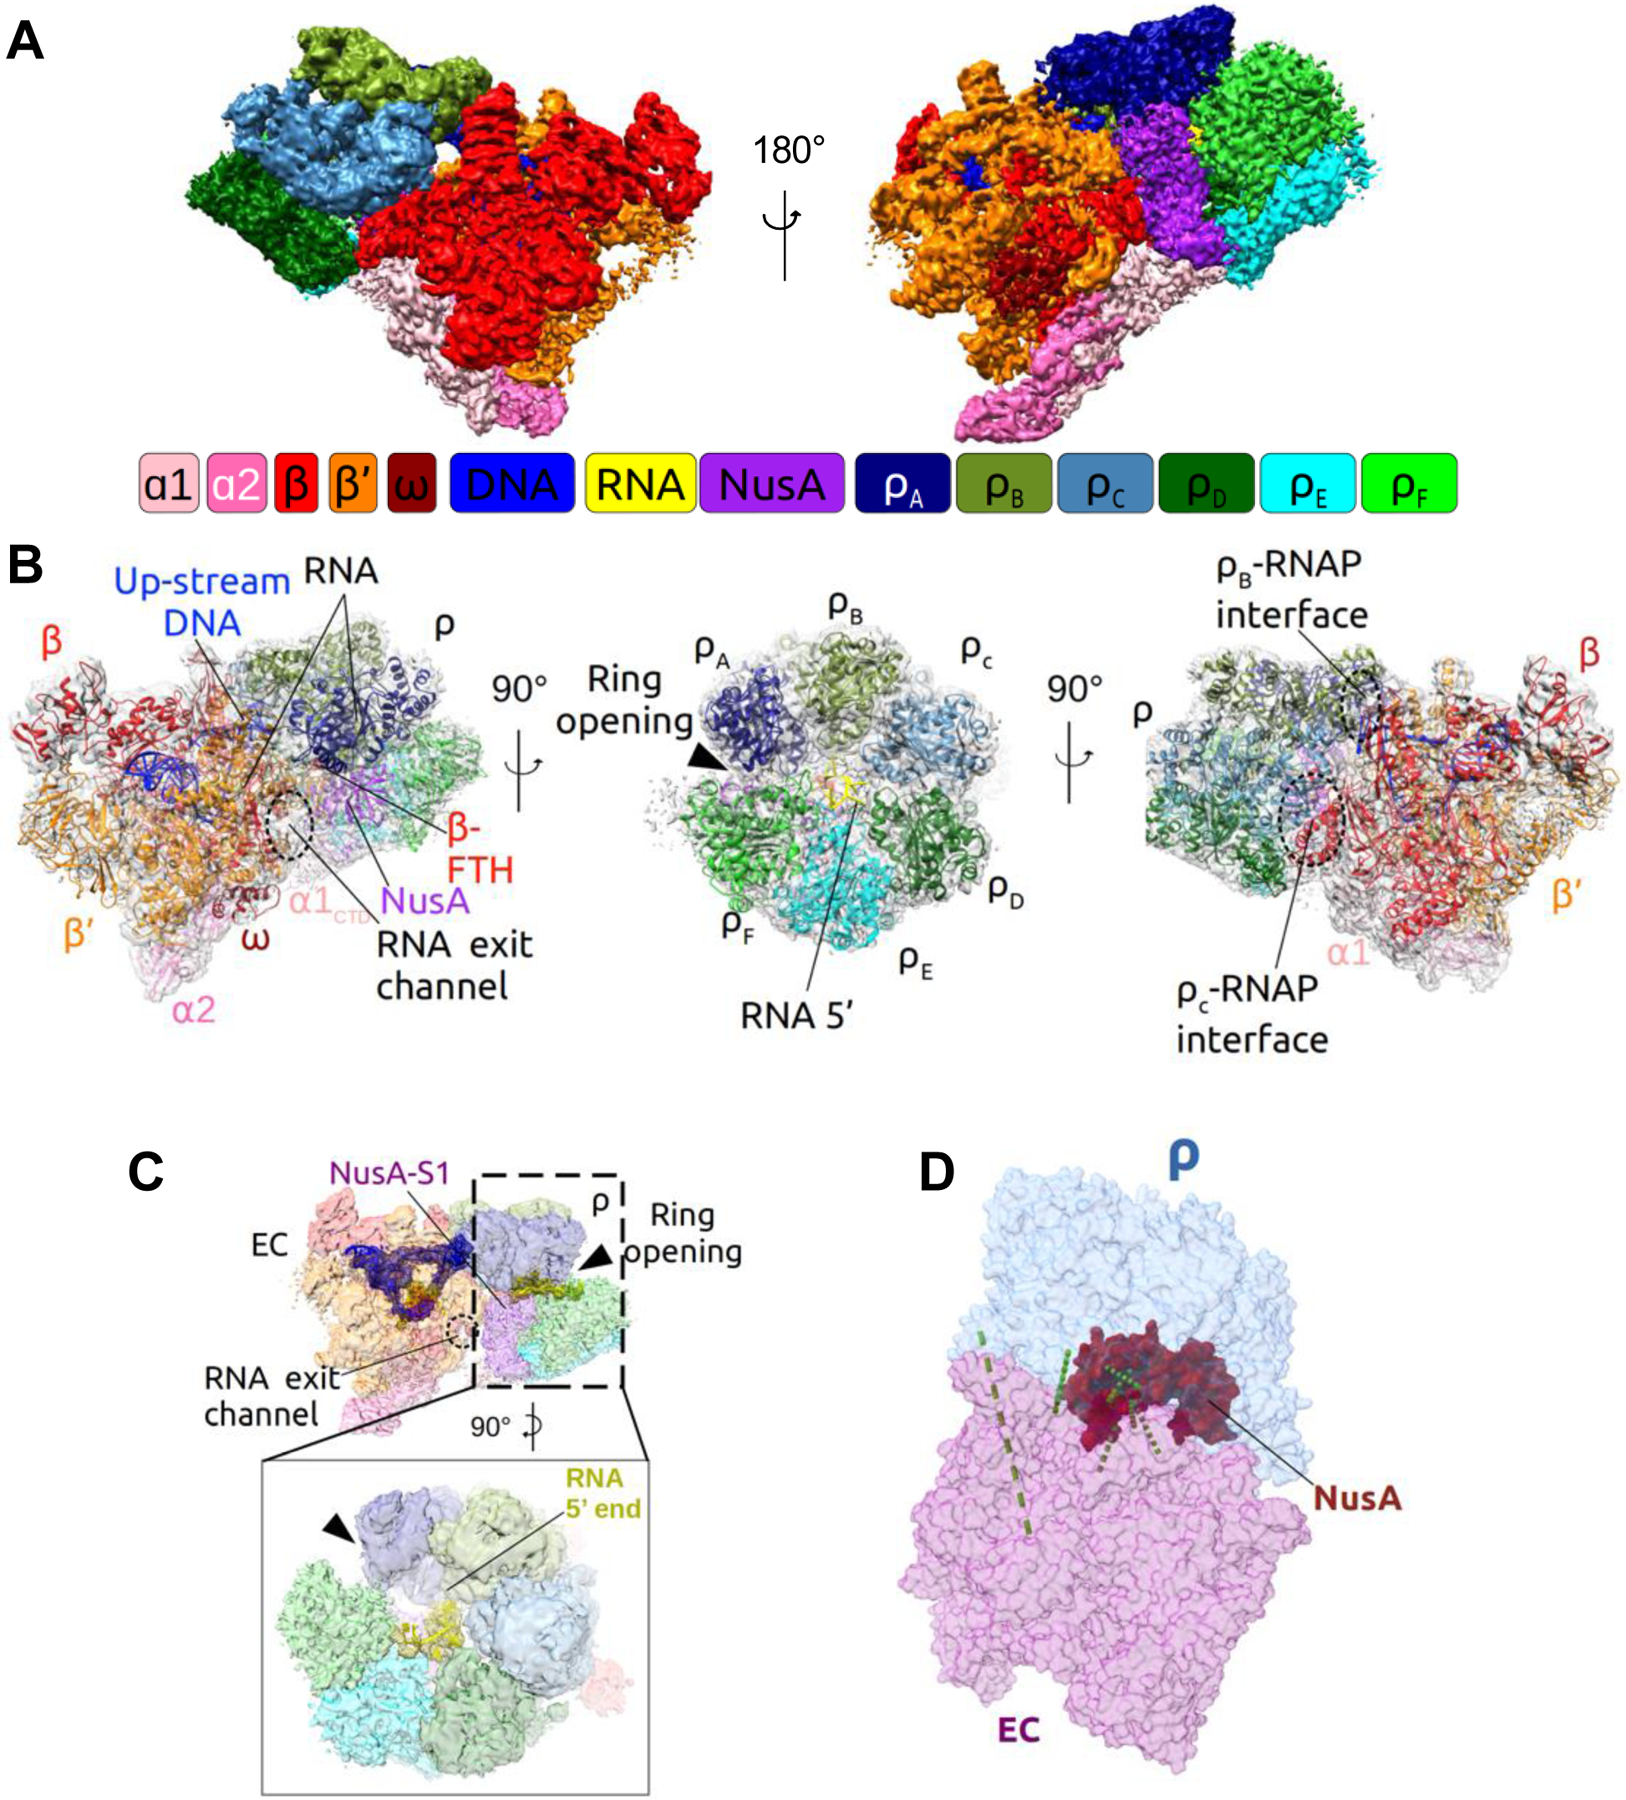
Figure 2. Overview of the Cryo-EM Structure of the PTC60.

(A) Surface view of the cryo-EM map of PTC60 at 3.1-Å nominal resolution. The diagram represents the color coding that is maintained in all figures, unless otherwise indicated. RNAP core subunits: ɑ1 - light pink, ɑ2 - pink, β - red, β’ - orange, ω - dark red; Rho subunits: ρA - navy, ρB - drab, ρC - light blue, ρD - dark green, ρE - cyan, ρF - green; NusA - purple; DNA - blue, RNA - yellow.
(B) Structural model of PTC60 with the density map shown as transparent gray surface and individual components denoted and shown in ribbon representation.
(C) Cryo-EM map of PTC60 with the model of the nucleic acid scaffold. The densities for DNA and RNA are shown in blue and yellow mesh representation, respectively, and the remaining map as transparent surface.
(D) Model of PTC60 with identified in-vivo crosslinks between the different modules (see Table S1 for details). RNAP is shown in purple, Rho in light blue, NusA in red, and in-vivo crosslinks as green dashed lines.
