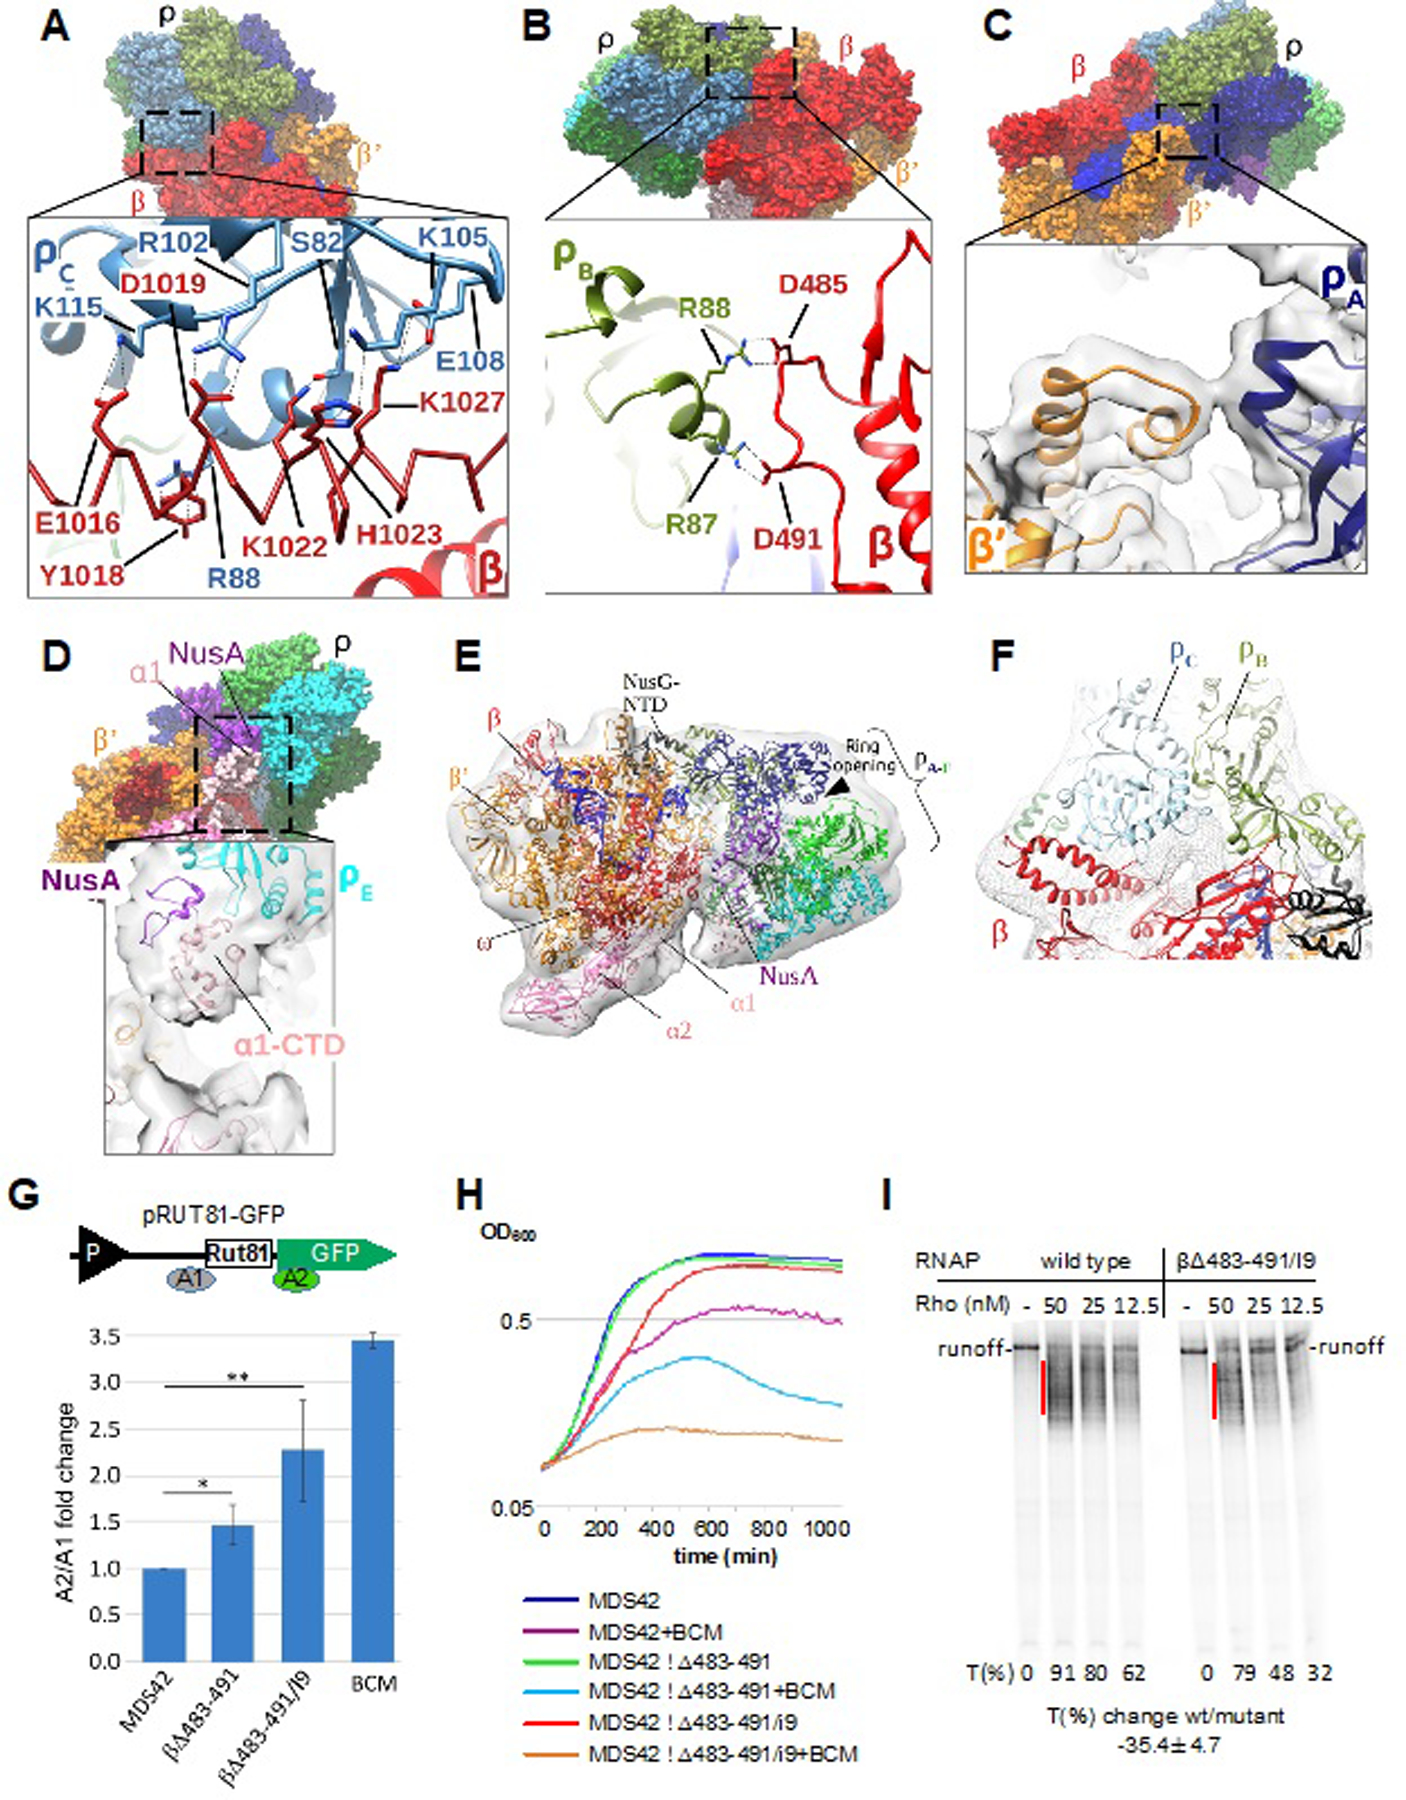
Figure 3. Major Protein-protein Interactions of Rho in the PTC and Their Functional Validation.

(A) Interaction of Rho subunit C (ρC) with residues of the RNAP β I9 domain in PTC60. Upper panel: overview of PTC60. Lower panel: magnified view of the boxed region. The RNAP β I9 domain is colored red with α-helix residues 1012–1038 shown as a Cα model, and ρC is colored light blue. Interacting residues are labeled and shown as sticks. Black dashed lines denote H-bonds, salt bridges and cation–π interactions.
(B) Interaction of Rho subunit B (ρB) with the RNAP β subunit (residues 483–491) in PTC60. Upper panel: overview of PTC60. Lower panel: magnified view of the boxed region. β is colored red and ρB is colored drab. Interacting residues are labeled and shown as sticks. Black dashed lines indicate H-bonds and salt bridges.
(C) Interaction of Rho subunit A (ρA) with RNAP β’ subunit (residues 283–287) in PTC60. Upper panel: overview of PTC60. Lower panel: magnified view of the boxed region. β’ is colored orange, ρA is colored navy, and the map is shown as transparent surface.
(D) Interactions of ρB with the RNAP α1-CTD in PTC60. Upper panel: overview of PTC60. Lower panel: magnified view of the boxed region. The map is shown as transparent surface.
(E) PTC18 overall map at 7.9-Å nominal resolution with fitted model. The map is shown as gray transparent surface. The PTC18 structure model is shown in ribbon representation, and DNA and RNA are shown as blue and yellow ladders, respectively.
(F) Interactions of ρB and ρC with RNAP β in PTC18. The β subunit is colored red, ρB and ρC are colored drab and light blue, respectively, and the map is shown as gray mesh surface. Red dash lines denote the inter-protein crosslinks βLys115–ρLys115 and βLys1027–ρLys105.
(G) Mutations of RNAP residues that interact with Rho in the PTC compromise Rho-dependent termination in vivo. Upper panel: Schematic diagram of the plasmid-based Rho-dependent termination reporter(Sedlyarova et al., 2017) used to test the effect of RNAP chromosomal mutations. P (black triangle) indicates the constitutive promoter, and Rut81 is the 81-nt long canonical Rho-utilization site. Colored bars A1 and A2 indicate the locations of qRT-PCR amplicons. Lower panel: fold changes in Rho-dependent termination for E. coli MDS42 strains containing different mutations in the RNAP β subunit. BCM is bicyclomycin (5 µg/ml), which was used as positive control. qRT-PCR data are shown in fold changes of the A2/A1 amplicon signal; data from three independent experiments are presented as the means ± SEM; **P < 0.01; *P < 0.05.
(H) Δβ483–491 and Δβ483–491/I9 are progressively more sensitive to bicyclomycin (BCM) than the parent MDS42 strain. Bioscreen C™-generated automated growth curves for MDS42 and mutant strains in LB with or without BCM (50 µg/ml) are shown.
(I) Δβ483–491/I9 RNAP is less susceptible to Rho-dependent termination in vitro. The radiogram shows a representative runoff assay used to assess the efficiency of Rho-dependent termination. The initial radiolabeled EC20 was chased in the absence or presence of the indicated amounts of Rho. The termination efficiency (%T) was estimated as the ratio between the signals within the termination zones (red lines) and the runoff. The average value of the termination change was calculated from three independent experiments using 12.5 nM Rho.
