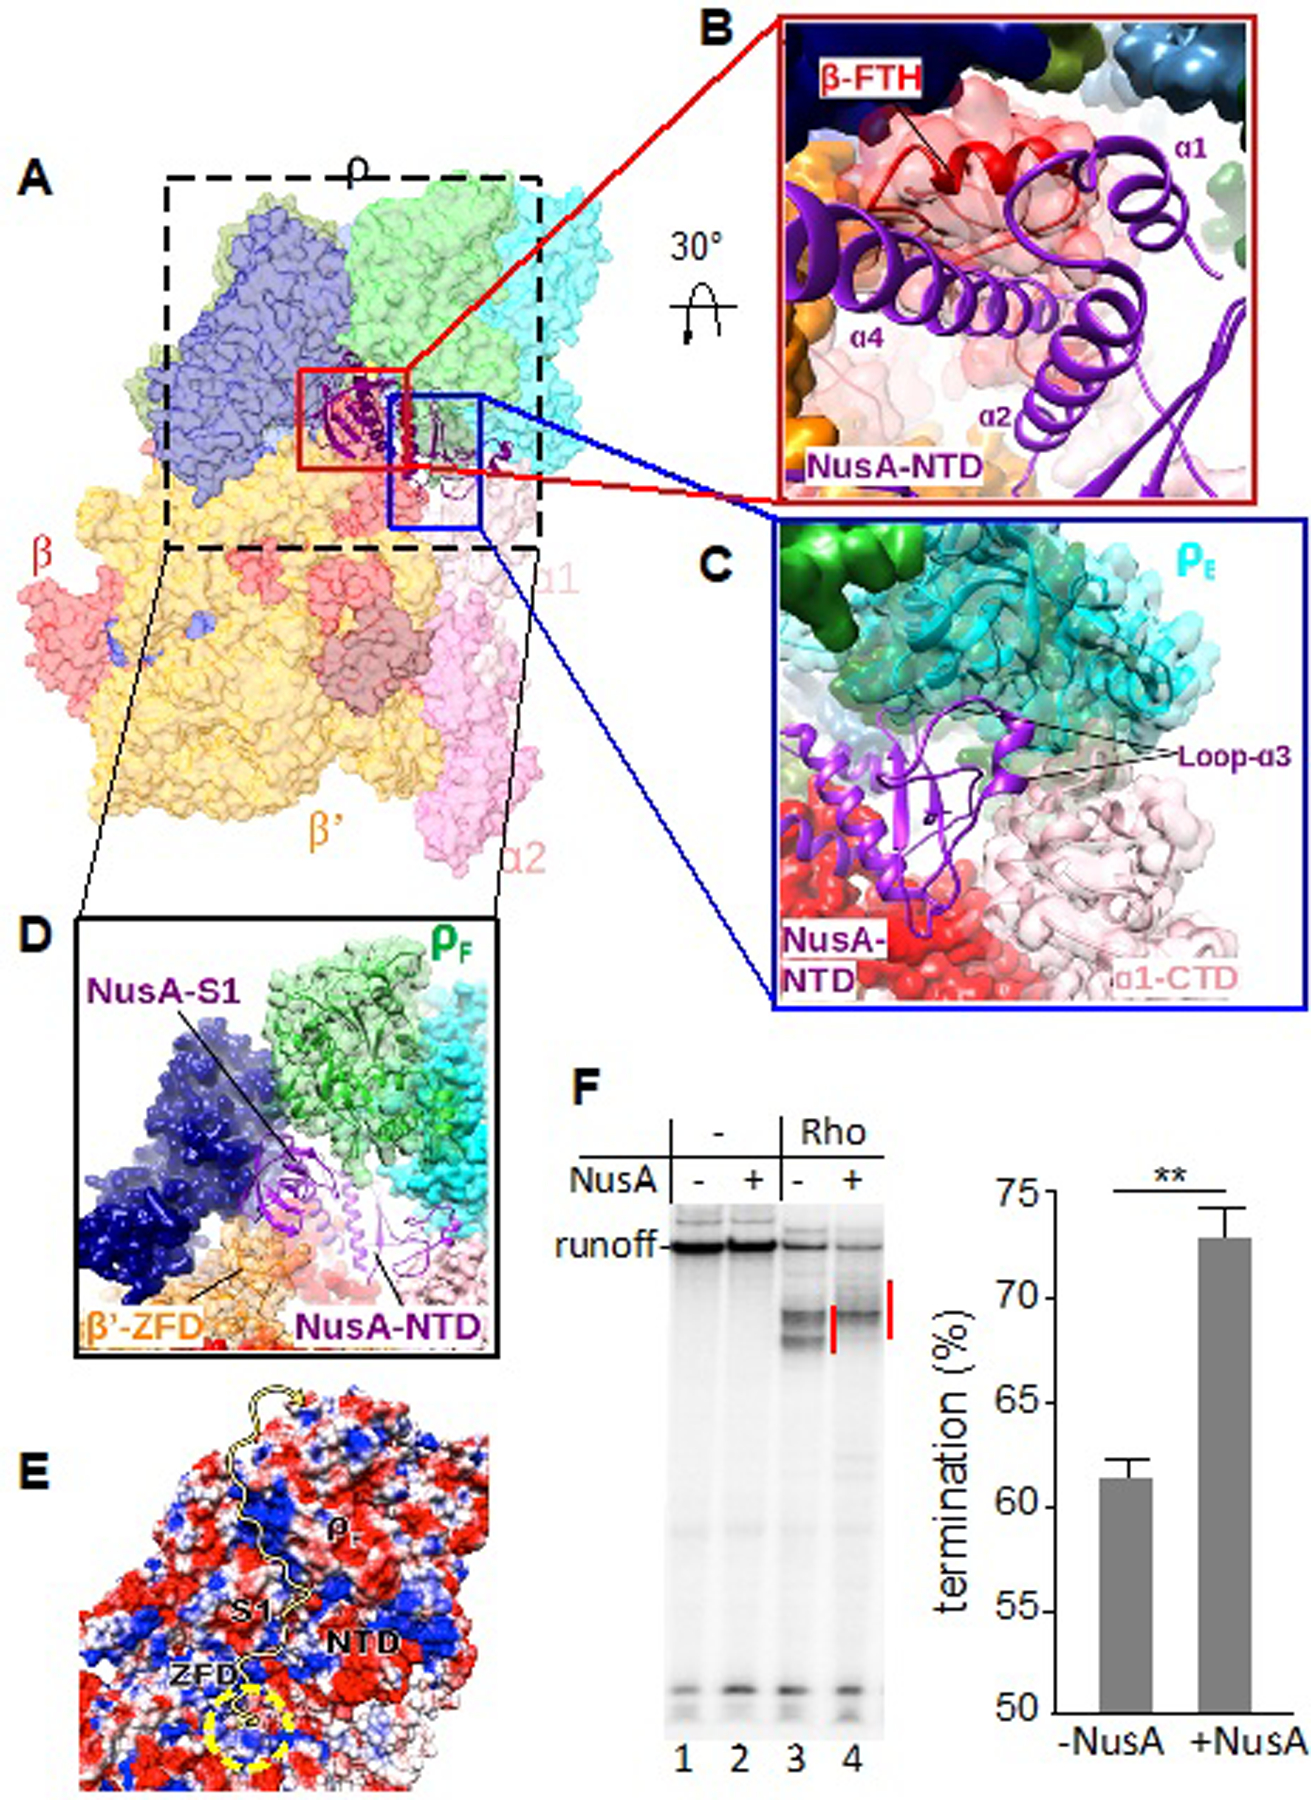
Figure 5. Principle Interactions of NusA in the PTC.

(A) Overview of PTC60 focusing on NusA interactions. The PTC60 model is color-coded as in Fig. 1 and shown in transparent surface representation, except for NusA, which is shown in ribbon representation.
(B) Close-up view of the interaction of NusA-NTD (purple) with RNAP β-FTH (red). RNAP β is shown both as transparent surface and cartoon representation to show secondary-structure elements (red). The secondary-structure elements of NusA-NTD that interact with β-FTH are labeled.
(C) Close-up view of the interaction of NusA-NTD (purple) with ρE (cyan) and ɑ1-CTD (light pink). ρE is shown both as transparent surface and cartoon representation to show secondary-structure elements. The interacting region of NusA-NTD is shown in cartoon representation and α1-CTD as transparent surface and cartoon representation in light pink.
(D) Close-up view of the interaction of the NusA S1 domain (purple) with the RNAP β’ zinc-finger domain (β’-ZFD) (orange) and ρF (green). β’ and ρF are shown as transparent surface and cartoon representation to show secondary-structure elements. e, Electrostatic potential of the surface formed by NusA S1 and NTD, β’-ZFD and ρF. The yellow arrow indicates the possible path for the nascent transcript. The yellow dashed circle indicates the RNA-exit channel of RNAP.
(F) Effect of NusA on Rho-dependent termination in vitro. Left panel: representative runoff assay used to assess the location and efficiency of Rho-dependent termination sites. The initial radiolabeled EC20 was chased in the absence (lanes 1, 2) or presence (lanes 3, 4) of Rho and/or NusA. Termination efficiency was estimated as the ratio between the signals within the termination zones (marked by red lines) and runoff. Right panel: NusA stimulates Rho-dependent termination in vitro. Data from three independent experiments are presented as the means ± SEM; **P < 0.01.
