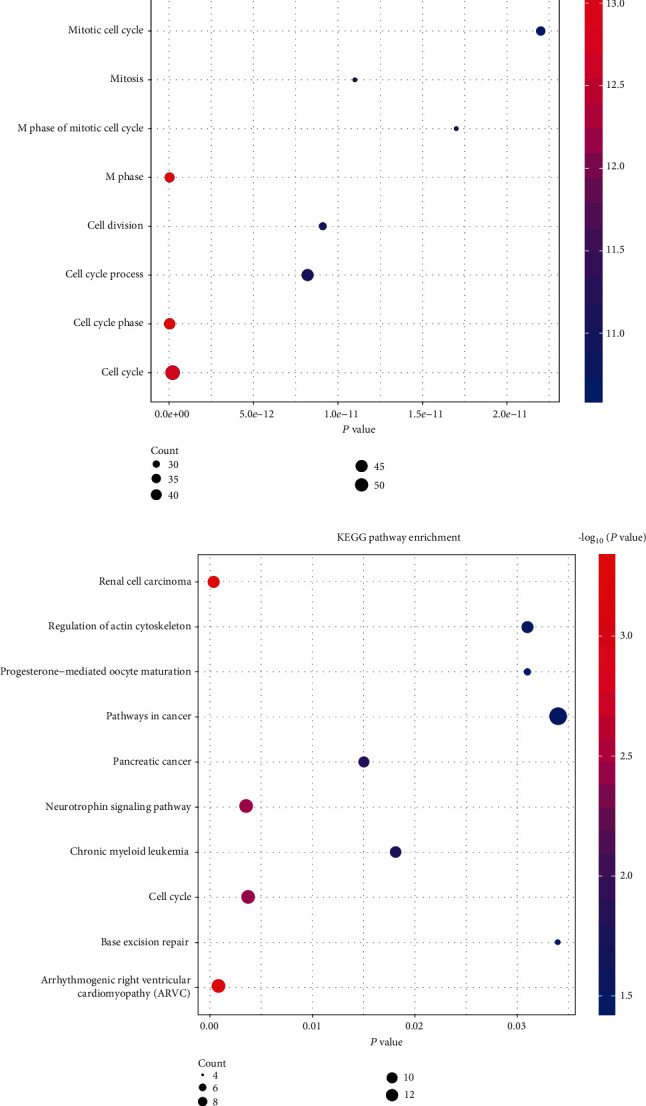
Figure 3.

Analysis of GO term enrichment and KEGG pathways of DEGs in lung cancer: (a) GO term enrichment analysis of DEGs in lung cancer in the TCGA cohort; (b) KEGG pathways of DEGs in lung cancer in the TCGA cohort. Reactor pathways of significant DEGs are shown on the y-axis. The x-axis represents the DEGs of different groups. Different colors of the dots indicated different P values, and the different sizes of the dots illustrated the gene ratio of the corresponding GO term or KEGG pathway.
