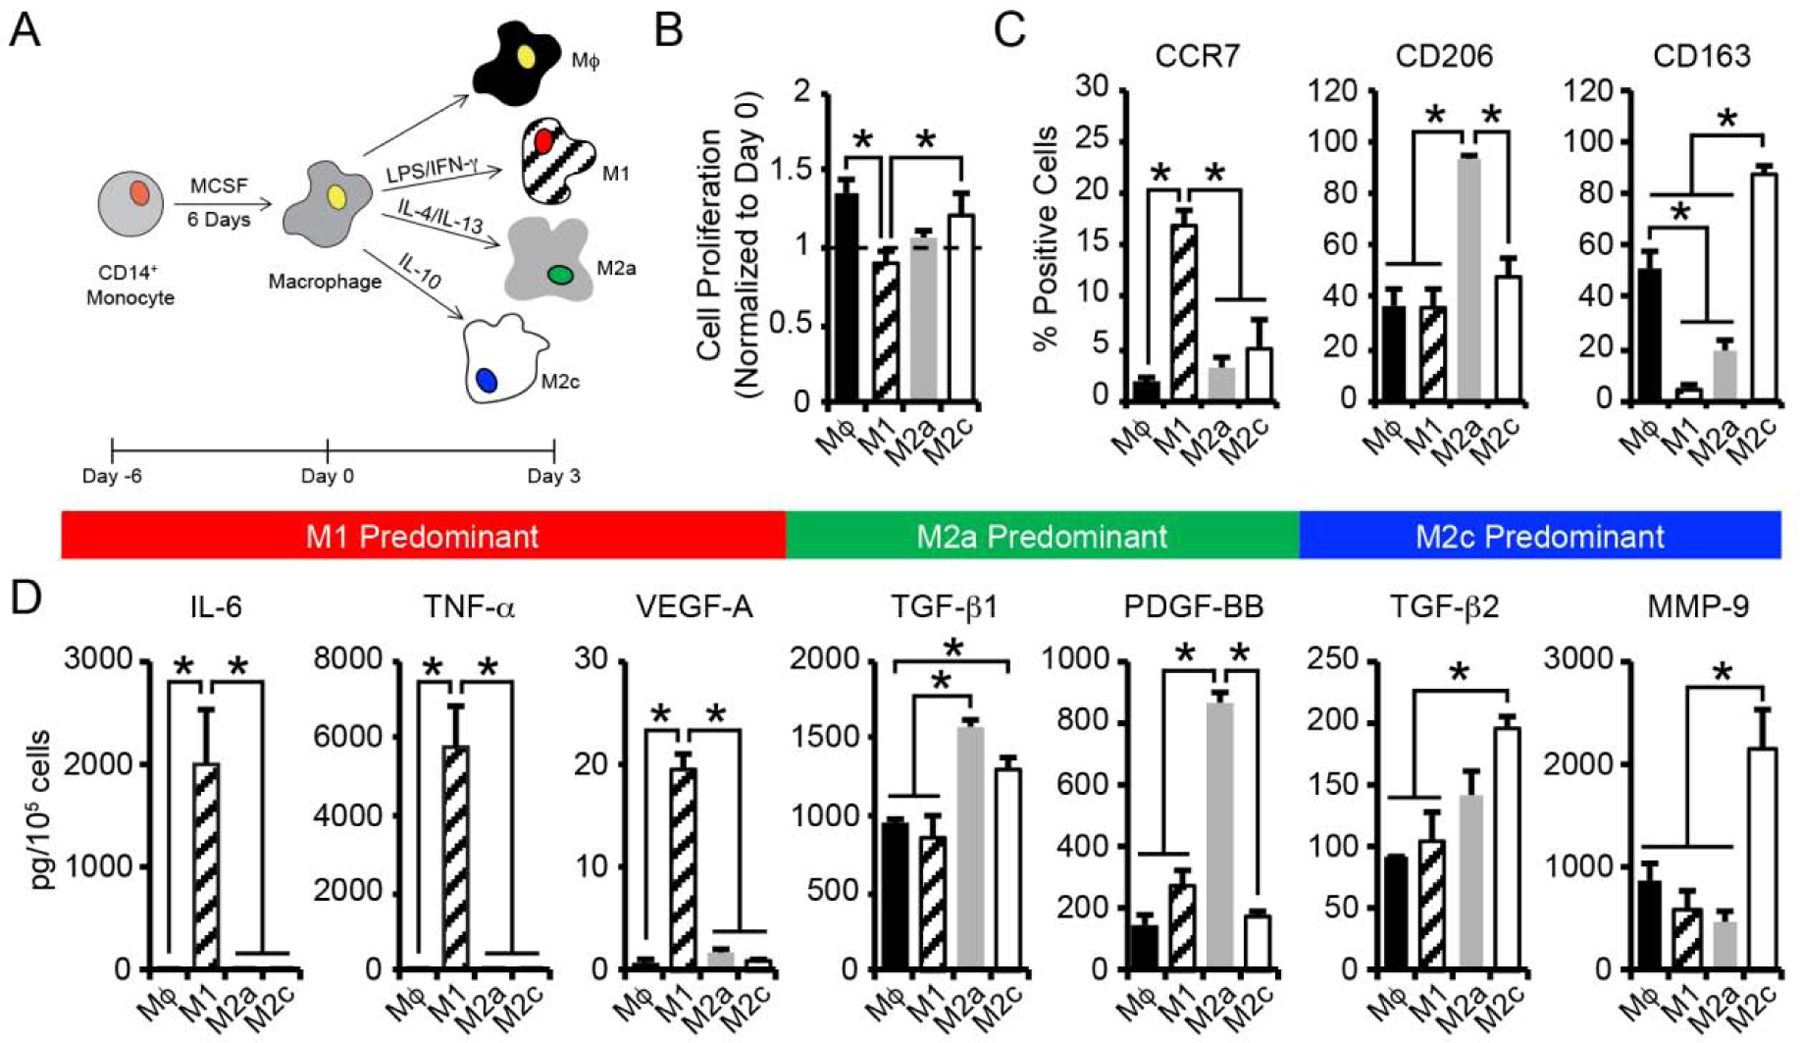
Figure 1.

(A) CB monocytes were differentiated to macrophages (Mϕ) and polarized to 3 different phenotypes (M1, M2a, M2c) using established cytokine cocktails. (B) Macrophage cell proliferation was determined by enumerating the number cells present after 3 days of culture, normalized to the number of cells initially seeded on day 0. (C) Flow cytometric analysis of the percentage of macrophage staining positively for each phenotypic surface marker. (D) Quantification of secreted proteins from macrophage phenotypes. In B-D, data are represented as the mean ± SEM, with n = 3 human donors per condition. A one-way ANOVA, followed by a Tukey HSD post hoc test, was used to detect statistical significance, *p<0.05.
