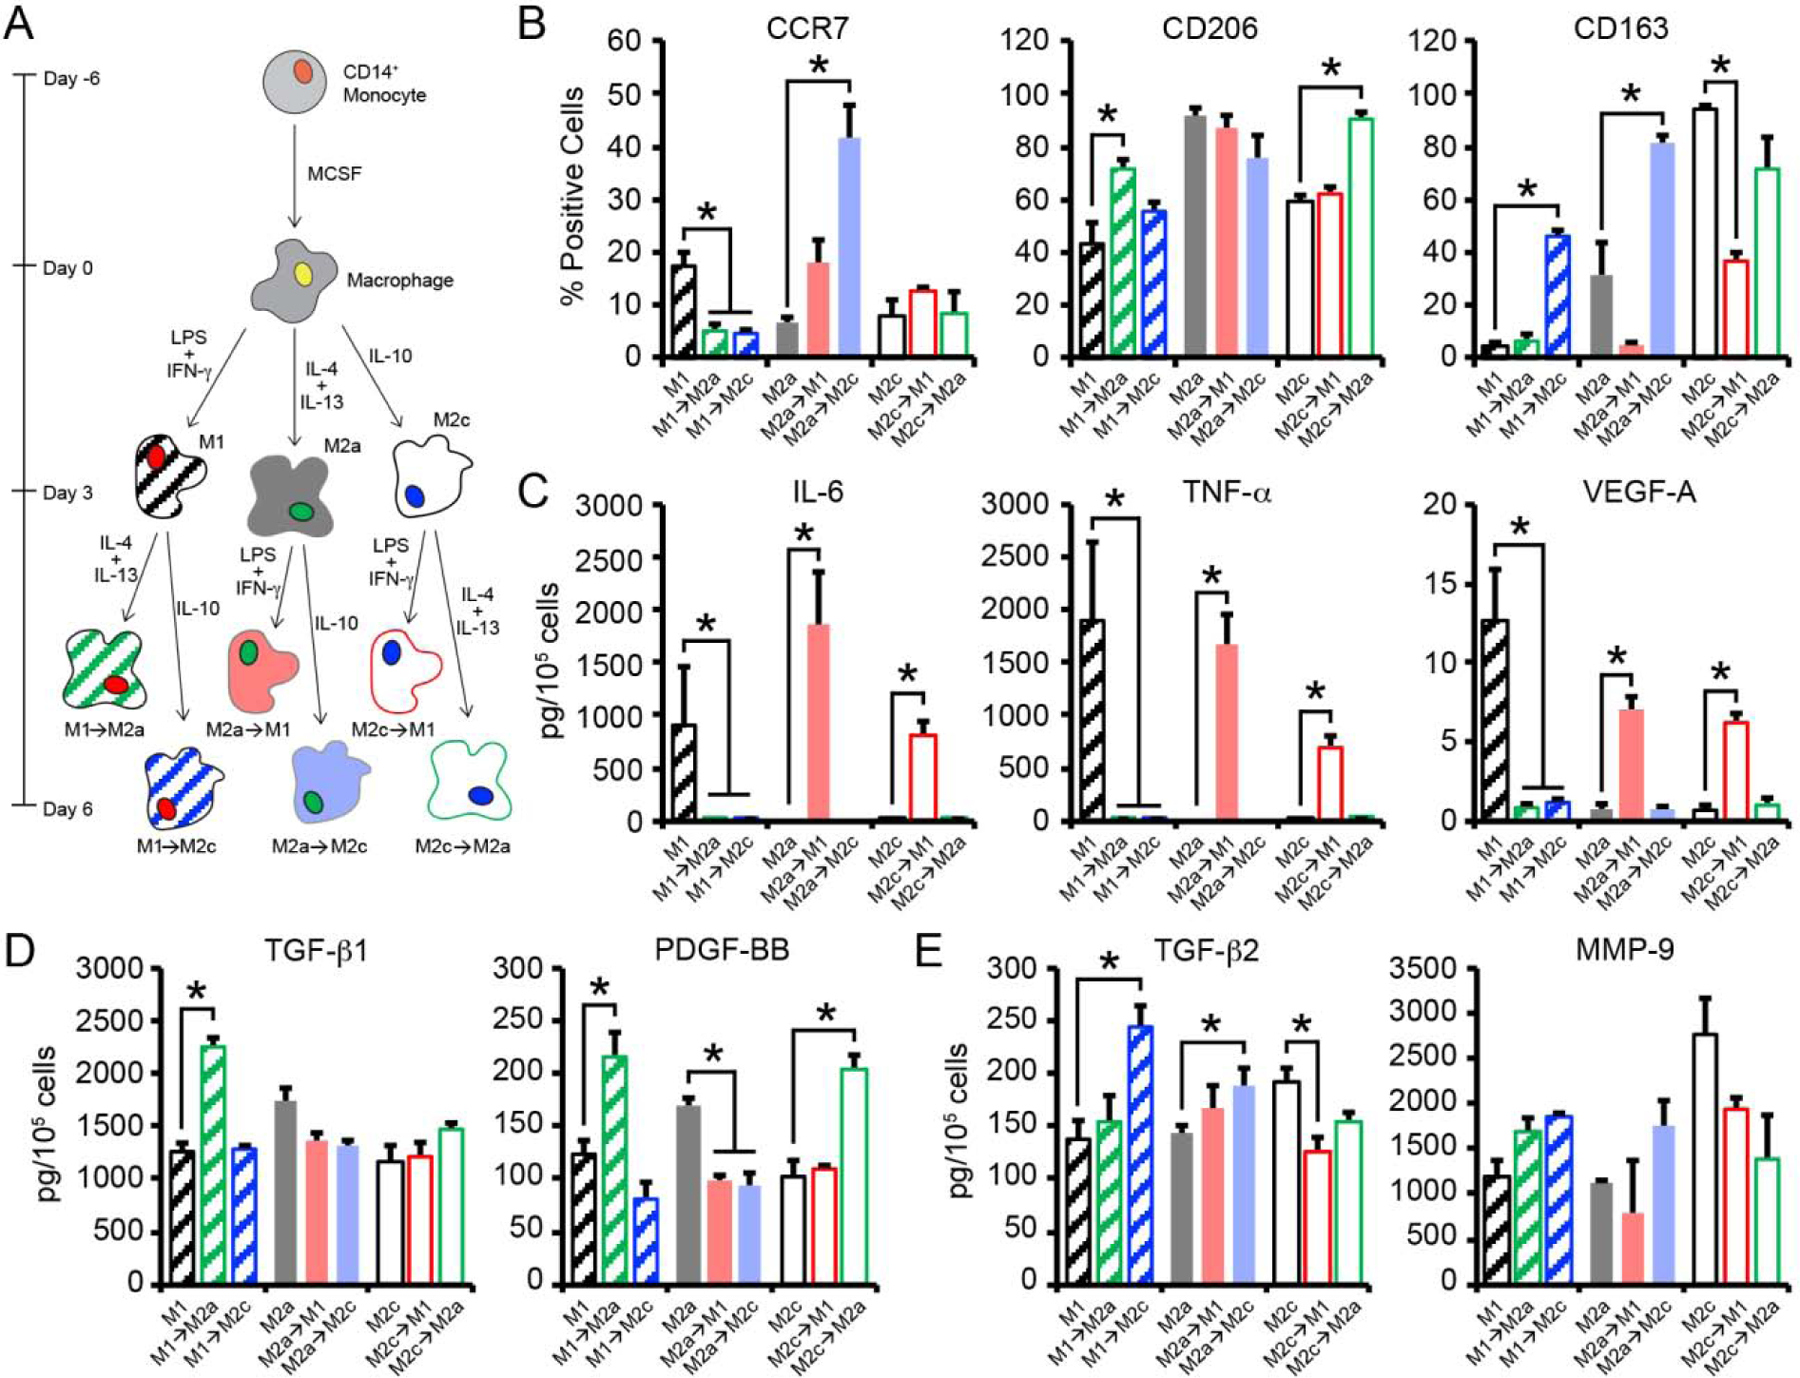
Figure 2.

(A) CB macrophages were polarized to 3 different phenotypes (M1, M2a, M2c) using established cytokine cocktails for 3 days. Thereafter, macrophages were switched to medium supplemented with alternative polarizing stimuli (M1→M2a, M1→M2c, M2a→M1, M2a→M2c, M2c→M1, M2c→M2a) and cultured for 3 additional days. (B) Flow cytometric analysis of the percentage of macrophage staining positively for each phenotypic surface marker after 3 days of initial culture or on day 6, after switching. (C-E) Quantification of secreted (C) M1, (D) M2a, and (E) M2c related proteins from macrophages. In B-E, data are represented as the mean ± SEM, with n = 3 human donors per condition. A one-way ANOVA, followed by a Dunnett’s post hoc test, was used to detect statistical significance for repolarized macrophage populations compared to their predecessor, *p<0.05.
