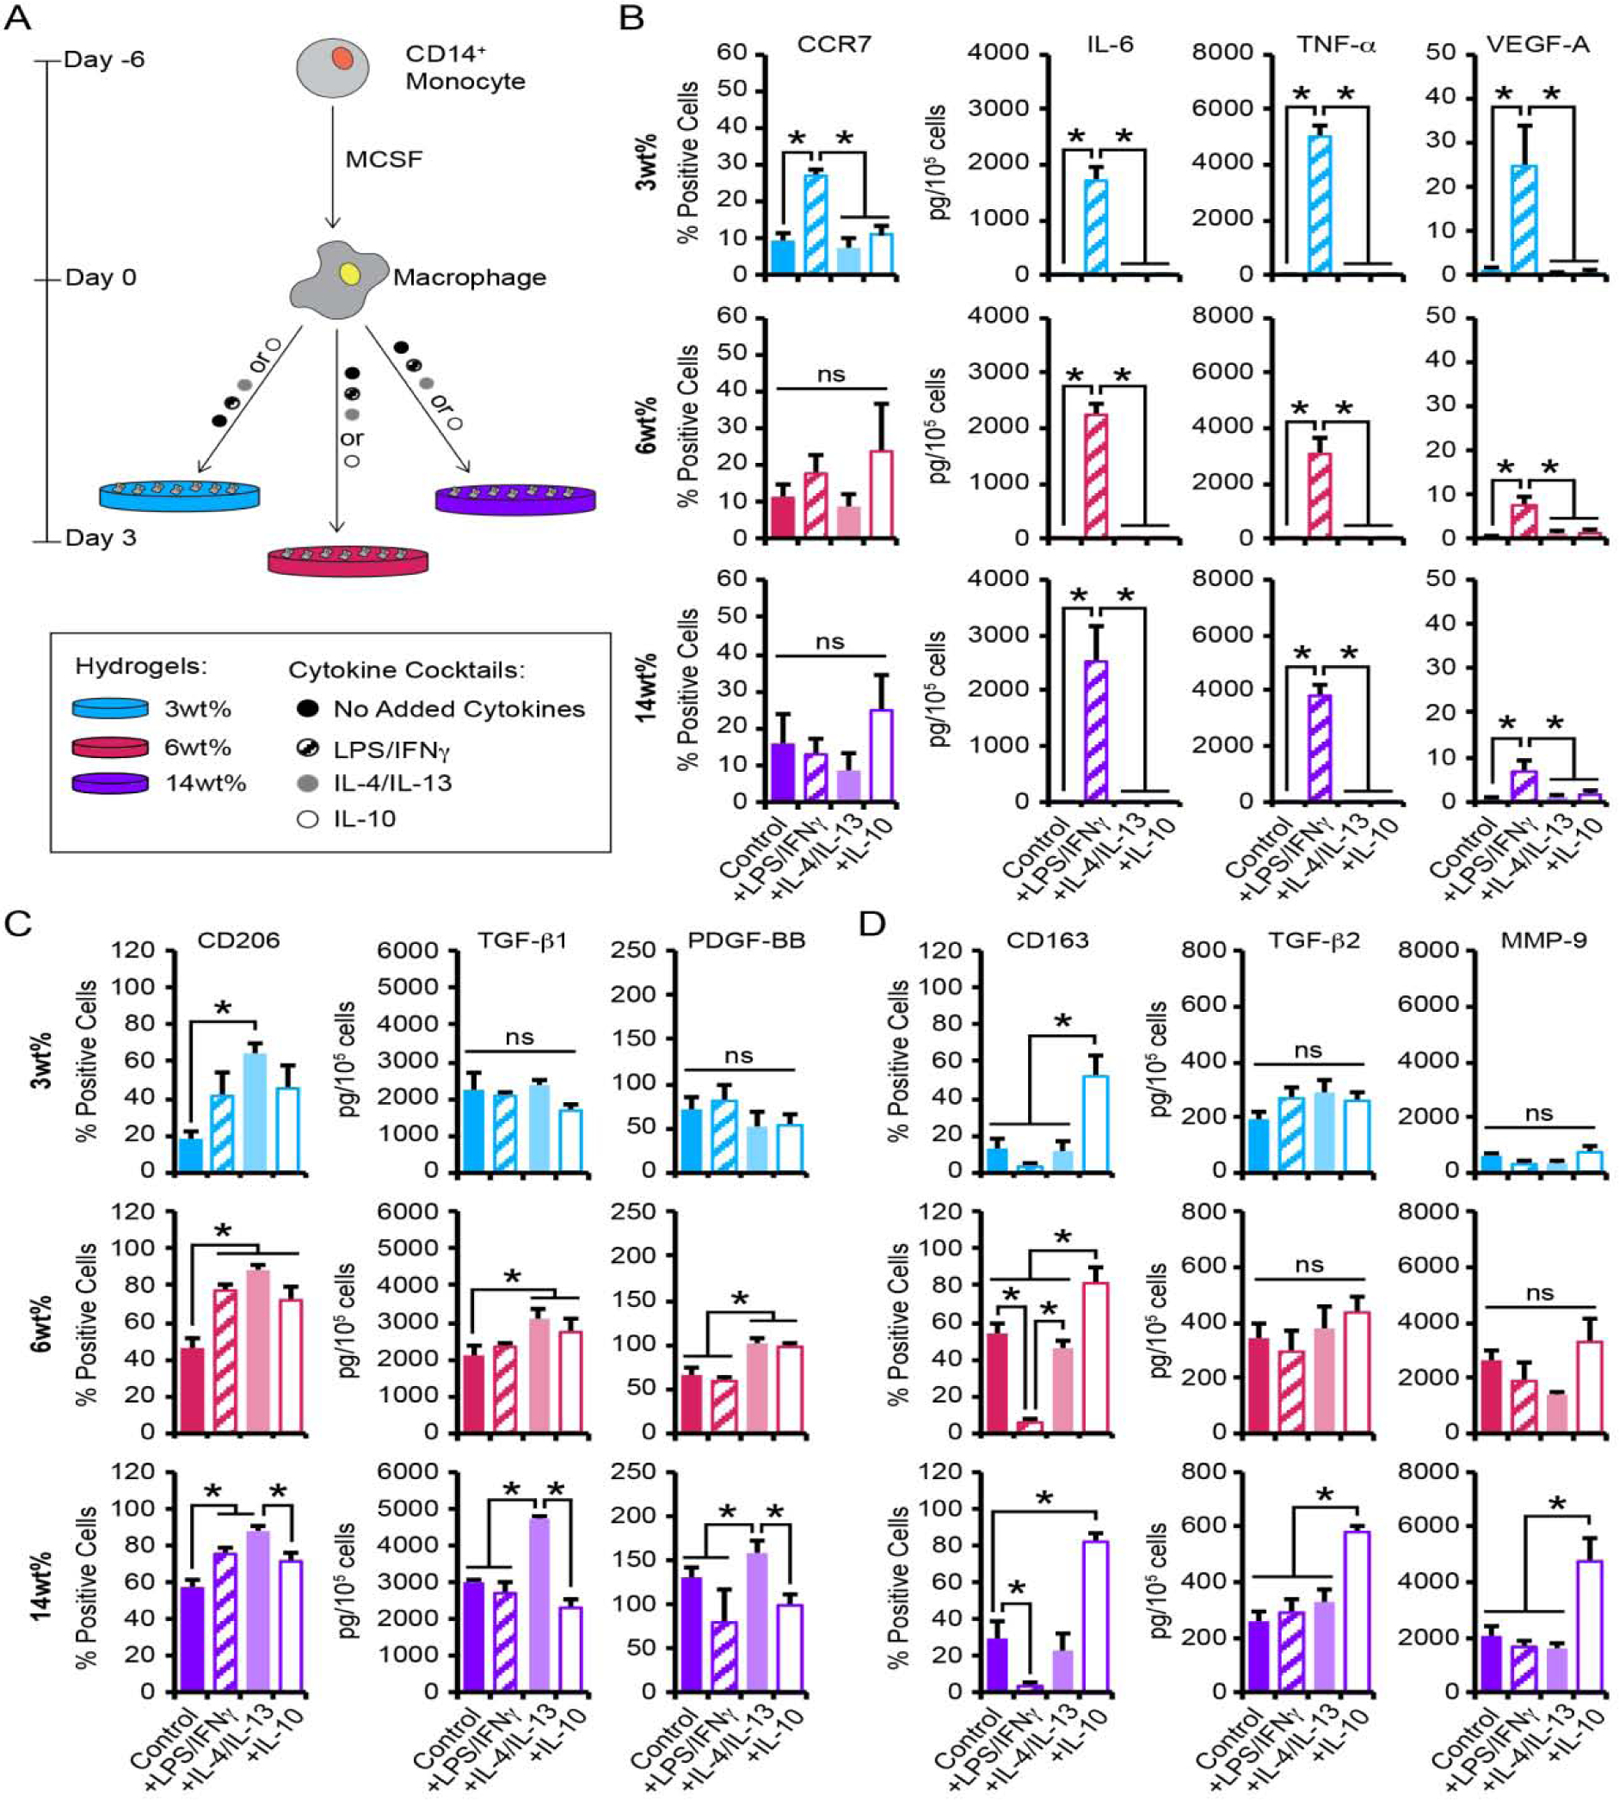
Figure 5.

(A) CB monocytes were differentiated to macrophages (Mϕ), seeded on 3wt%, 6wt%, or 14wt% hydrogels, and cultured with or without the presence of pro- or anti-inflammatory cytokines. (B-D) Flow cytometric analysis of the percentage of macrophage staining positively for each phenotypic surface marker and quantification of secreted proteins from macrophage cultured on hydrogels for 3 days. Biomarkers for (B) M1, (C) M2a, and (D) M2c phenotypes were evaluated. B-D, data are represented as the mean ± SEM, with n = 3 human donors per condition. A one-way ANOVA, followed by a Tukey HSD post hoc test, was used to detect statistical significance, *p<0.05, ns = no significance.
