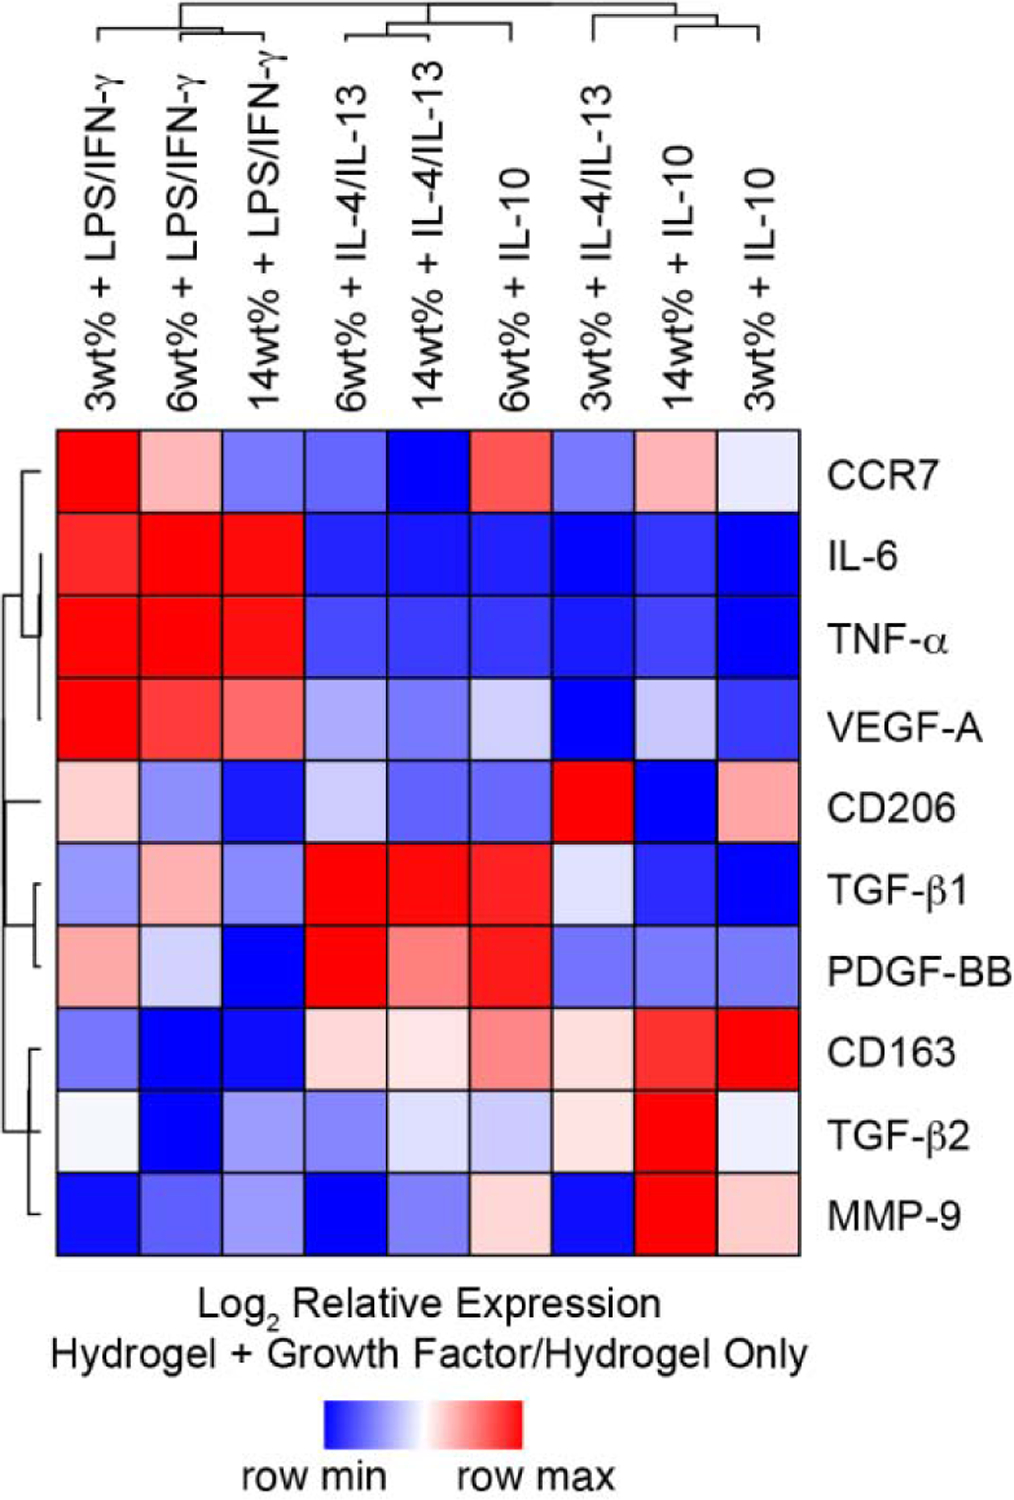
Figure 7.

Hierarchical cluster analysis of surface markers and growth factor production data for macrophage cultured on 3wt%, 6wt%, and 14wt% hydrogels, and cultured with and without the presence of pro- or anti-inflammatory cytokines for 3 days. Columns represent each hydrogel/cytokine cocktail combination normalized to hydrogel alone; rows represent each surface marker or growth factor. Heat map colors represent the relative production of each biomarker normalized to the corresponding hydrogel-only control value, with blue indicating production that the value is in the lower half of the range across treatments for that biomarker and red indicating relatively elevated levels, as indicated in the scale bar (log2-transformed scale).
