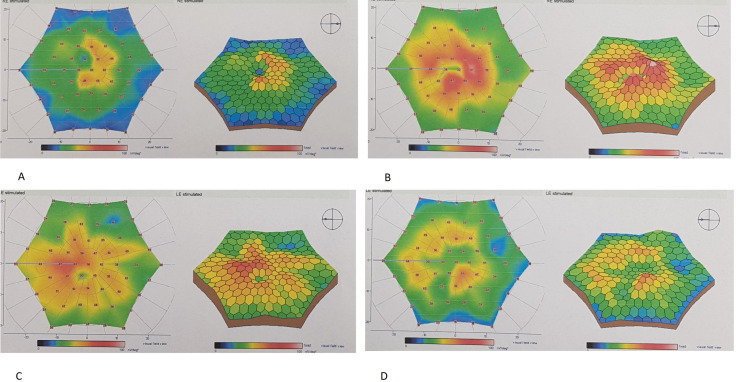
Fig. 3.
mfERG recording of the same AMD subject before treatment (A) and one year after treatment (B). Note the improvements in mfERG recordings especially in the central rings shown with the color maps and 3D visualization maps. mfERG recordings of the fellow eye showed worsening in the central areas (C, D).

