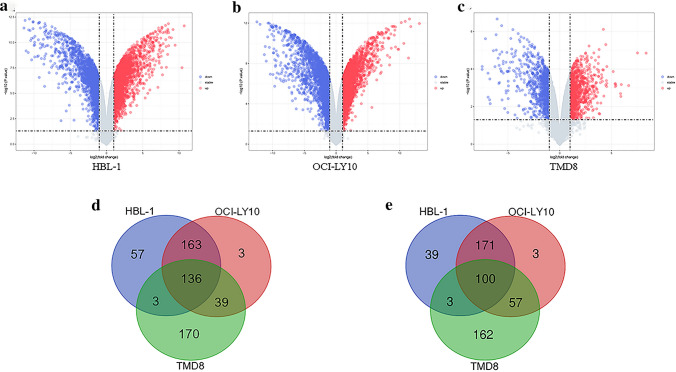
Fig. 1.
Identification of DEGs between Ibrutinib-resistant cell lines and sensitive cell lines in ABC-DLBCL. Volcano plot of a HBL-1, b OCI-LY10 and c TMD8. Blue plots represent downregulated genes, while red plots represent upregulated genes. Identification of the oncordant expression changes d downregulated e upregulated DEGs from three cell lines were performed by Draw Venn Diagram website (http://bioinformatics.psb.ugent.be/webtools/Venn/). Blue circles indicate HBL-1 cell line, red circles indicate OCI-LY10 cell line, green circles indicate TMD8 cell line

