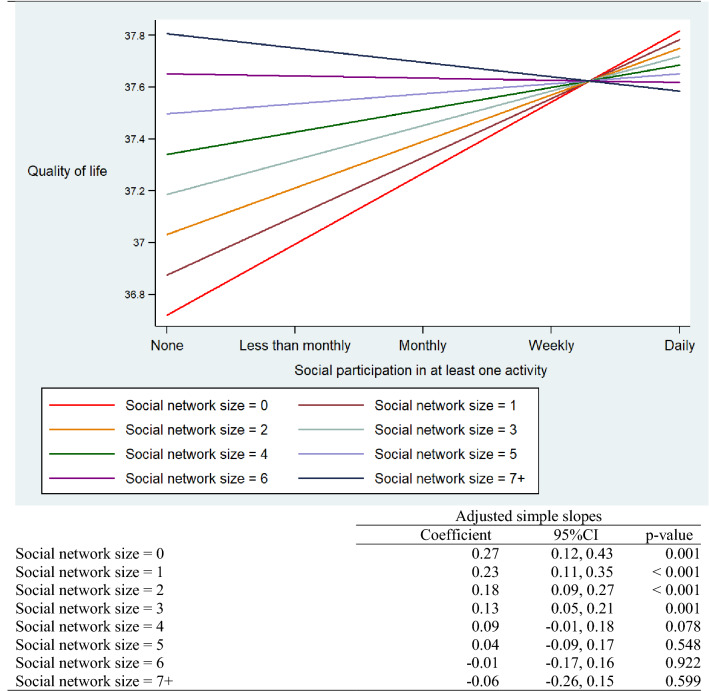
Table 3.
Adjusted simple slopes for social participation predicting quality of life at 2-year follow-up among older adults in Europe
Social network size = the number of close social ties. The model adjusted for age, gender, marital status, education, income, occupational status, activity limitations, chronic conditions, and quality of life at T1. Based on the 12-item Control, Autonomy, Self-realization, Pleasure scale (CASP-12), range 12–48. The y-axis represents predicted values for quality of life

