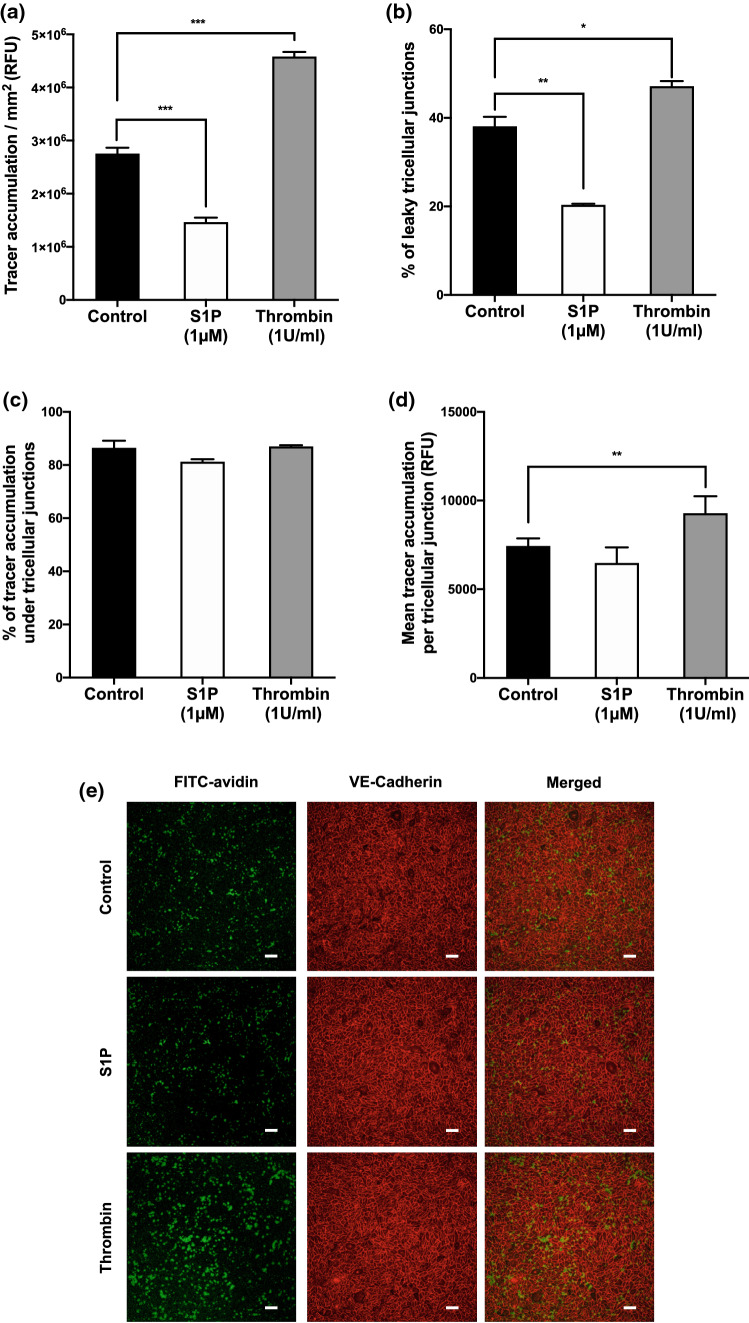
Figure 4.
(a) Total FITC-avidin accumulation, (b) percentage of permeable tricellular junctions, (c) percentage of the total tracer accumulation due to tricellular junctions, (d) mean tracer accumulation per permeable tricellular junction, and (e) confocal images (tracer accumulation, green; VE-cadherin, red), all for untreated HAEC monolayers or monolayers treated with S1P or thrombin. RFU relative fluorescence units. Bar = 100 μm.

