
Figure 1.
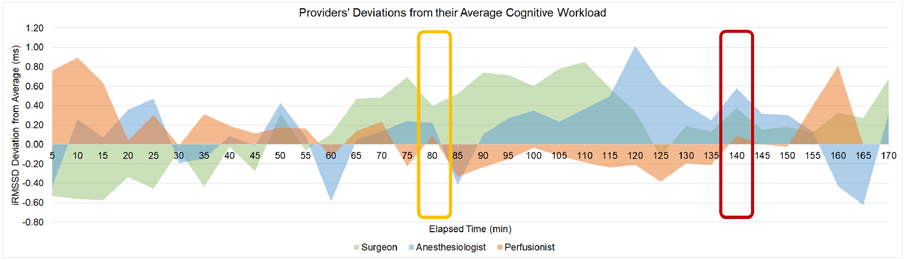
provides an example of how concurrent positive deflections and positive peaks were identified across cases. Elapsed time is shown on the x-axis For every 5 minutes of elapsed time, RMSSD was calculated and inverted such that higher values on the y-axis represent higher levels of cognitive workload. Because these values were normalized to each individual’s average RMSSD over the course of the surgery, deviations from the x-axis indicate increases (positive y-values) and decreases (negative y-values) in cognitive workload. This figure highlights one example of concurrent positive deflections (80 minutes elapsed, yellow square) and one example of concurrent positive peaks (140 minutes elapsed, red square). iRMSSD = inverted root mean square of the successive differences