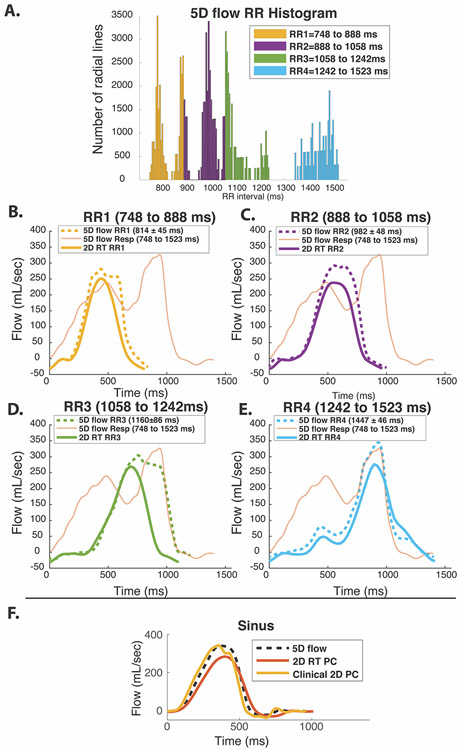
Figure 4: Flow waveforms of in vitro 2D RT and 5D flow.
A, histogram of RR-intervals during 5D flow scan with colors representing 4 RR bins (RR1-RR4) used for both 5D flow and RT flow analysis. B-E represent RR1 through RR4 for arrhythmic pulsatile experiment. RT colors correspond to the colors shown in Figure 2B. 5D flow curves from a planar location for each reconstructed RR-duration bin are delineated with dotted lines. The respiratory-resolved 5D flow reconstruction is overlaid over each plot (thin orange line). RR binning was able to recover the 5D flow waveforms (black line) corresponding to the real time scan while the respiratory-resolved 5D reconstruction did not match any RT flow curves. F, sinus experiment with RR=1000 ms demonstrates relative RT underestimation compared to the clinically respiratory-resolved ECG-gated 2D PC scan.

