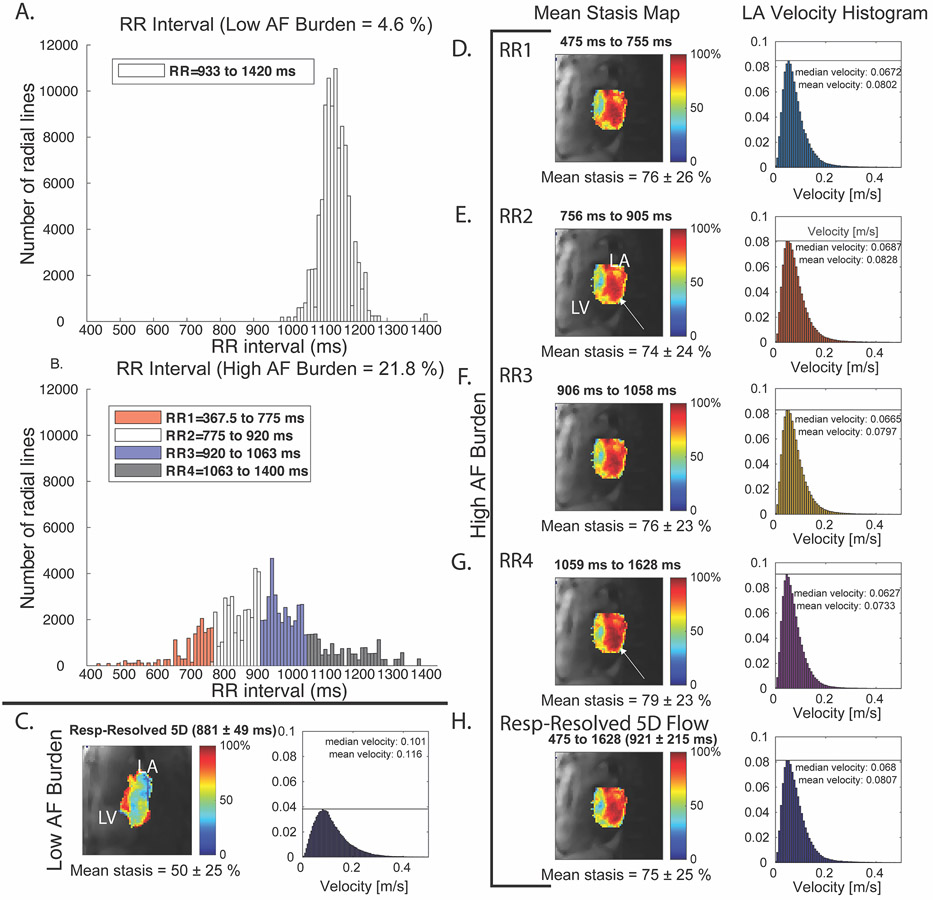
Figure 5: Example results from AF and sinus patient.
A, stasis maps and velocity histograms of the LA for a patient in AF. A, B, histogram with color-coded bins of low and high AF burden patients. B, patient with low AF burden during imaging shows much lower stasis and higher velocities compared to RR interval binned reconstruction of high AF burden patient (D-H). All high AF burden stasis maps appear similar (RR-binned and respiratory-resolved 5D reconstruction, with slight increases in stasis with longer RRLength (white arrows).

