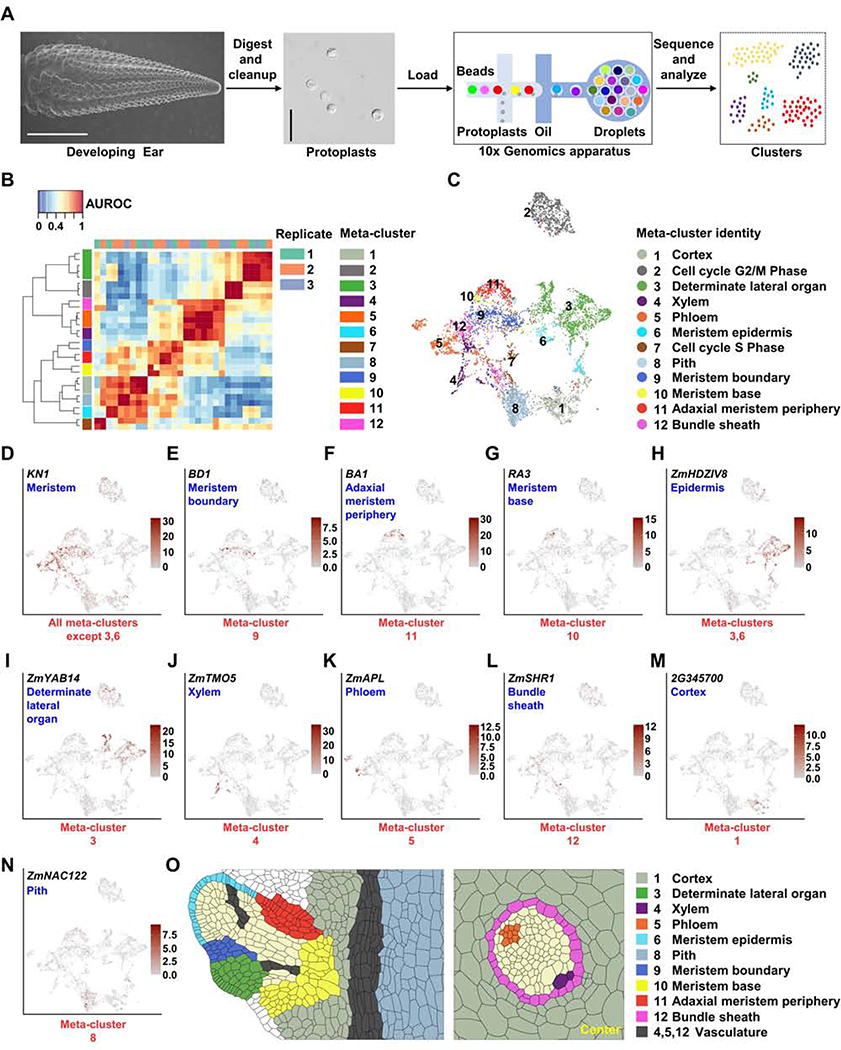
Figure 1: Isolation of Maize Ear Protoplasts to Construct a Single-Cell Transcriptomic Atlas.
(A) Experimental design, the first panel shows a scanning electron microscope image of a 5–10mm developing ear (scale bar = 2mm), second panel image of ear protoplasts, scale bar = 50μm. (B) MetaNeighbor identifies 12 reproducible meta-clusters (left color blocks) across three biological replicates (top color blocks) of single-cell RNA-seq datasets. (C) 12 meta-clusters displayed by an integrated Uniform Manifold Approximation and Projection (UMAP) plot in two dimensions, with each dot representing a cell. (D-N) UMAP plots of marker genes predicting the identities of meta-clusters, with color scale indicating normalized expression level. (D) KN1, meristem, all meta-clusters except 3 and 6; (E) BD1, meristem boundary, meta-cluster 9; (F) BA1, adaxial meristem periphery, meta-cluster 11; (G) RA3, meristem base, meta-cluster 10; (H) ZmHDZIV8, epidermis, meta-clusters 6 and part of 3; (I) ZmYAB14, determinate lateral organ, meta-cluster 3; (J) ZmTMO5, xylem, meta-cluster 4; (K) ZmAPL, phloem, meta-cluster 5; (L) ZmSHR1, bundle sheath, meta-cluster 12; (M) GRMZM2G345700 (2G345700), cortex, meta-cluster 1; (N) ZmNAC122, pith, meta-cluster 8. (O) Sketches of longitudinal section of a spikelet meristem (left panel) and transverse section of vascular bundle (right panel) showing cell/domain identities in scRNA-seq meta-clusters.

