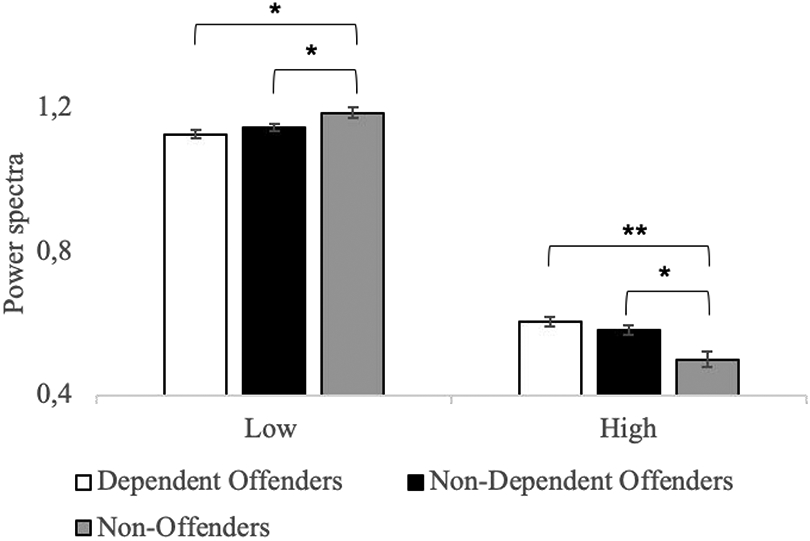
Figure 2. Mean power spectra differences between groups during the overall resting-state activity.

Mean power spectra differences in the low-, mid- and high-frequency bins between Dependent Offenders (white), Non-Dependent Offenders (black), and Non-Offenders (grey) during overall resting-state activity. Dependent and Non-Dependent Offenders exhibited an overall lower activity amplitude during low-frequency activity and a higher activity amplitude during high-frequency activity in comparison to Non-Offenders. However, no significant differences were observed between the two Offender sub-groups in any of the frequency bins.
* p(FWE) < 0.05 ** p(FWE) < 0.001, error bars = SEM
