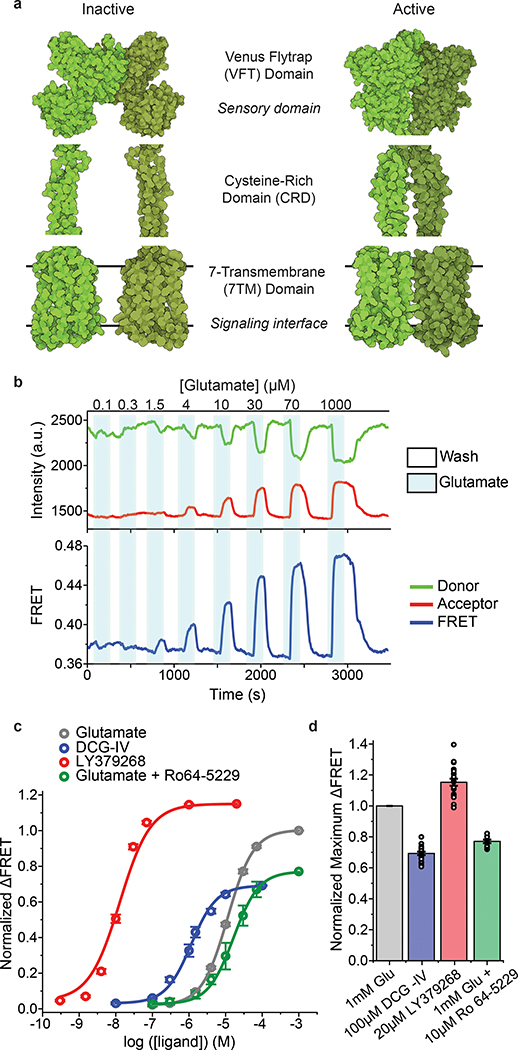
Fig. 1: Design and characterization of the FRET-based CRD conformational sensor.
a, Cartoon illustrating the arrangement of the three structural domains of mGluR5 in the inactive (RCSB Protein Data Bank (PDB) accession 6N52) and active (PDB accession 6N51) states. b, Representative donor and acceptor intensities and corresponding FRET signal from a cell in response to glutamate application. c, Dose-response curves from live-cell FRET titration experiments for glutamate (grey), LY379268 (red), DCG-IV (blue) or glutamate +10 μM Ro64–5229 (green) in HEK293T cells. Each titration curve is normalized to the 1 mM glutamate response. Data represent mean ± s.e.m. of N=26, 20, 10 and 13 cells for glutamate, LY379268, DCG-IV and glutamate +10 μM Ro64–5229, respectively, examined over 3 independent experiments. d, Maximum FRET change in the presence of saturating LY379268 (red), DCG-IV (blue) and glutamate +10 μM Ro64–5229 (green) normalized to the 1 mM glutamate response (grey) in HEK293T cells. Data represent mean ± s.e.m. of N=21, 19 and 9 cells for LY379268, DCG-IV and glutamate +10 μM Ro64–5229, respectively, examined over 3 independent experiments.

