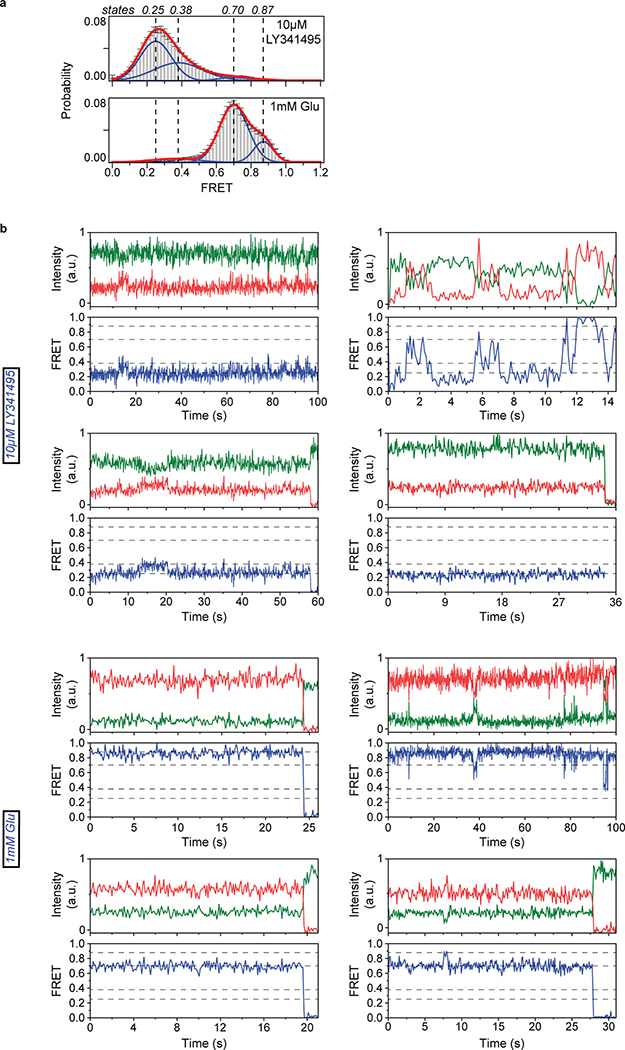
Extended Data Fig. 5. mGluR3 undergoes a 4-state activation process.
a, smFRET population histograms of mGluR3 CRD sensor (labeled at residue 557) in the presence of competitive antagonist (LY341495; 221 total molecules) or saturating glutamate (290 total molecules). Data represent mean ± s.e.m. of N=3 independent experiments. Histograms are fitted (red) to 4 Gaussian distributions (blue) centered around 0.25 (state 1), 0.38 (state 2), 0.7 (state 3) and 0.87 (state 4), denoted with dashed lines. b, Example single-molecule time traces of mGluR3 CRD sensor in the presence of antagonist (LY341495) or saturating glutamate showing donor (green) and acceptor (red) intensities and corresponding FRET (blue). Dashed lines represent 4 distinct FRET states. Data was acquired at 100 ms time resolution.

