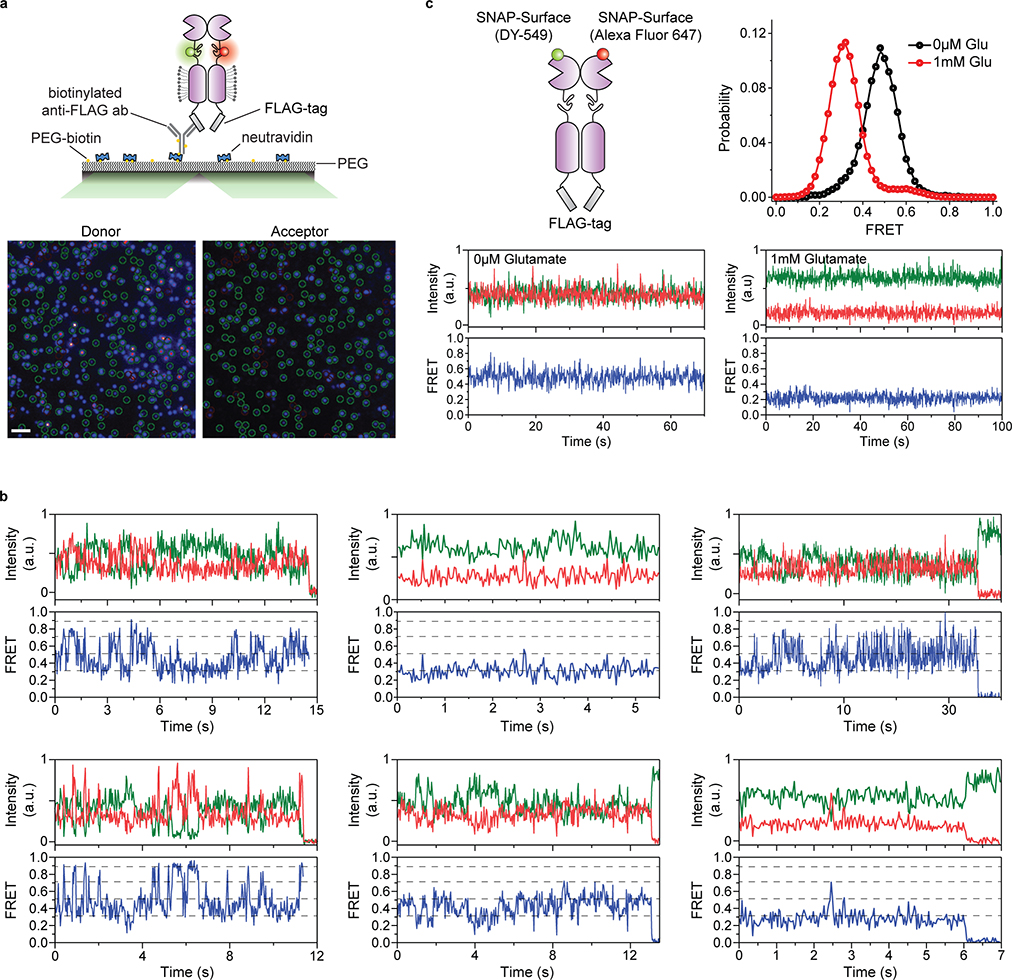
Extended Data Fig. 3. Example single-molecule time traces of CRD and VFT domain sensors.
a, Schematic of the single-molecule experiments (top).Representative frame from a single-molecule movie with the donor channel (Cy3) on the left and acceptor channel Cy5) on the right (bottom). Molecules selected by analysis software for downstream processing are indicated by green circles. Scale bar, 3 μm. b, Example single-molecule time traces of the 548UAA in the absence of glutamate (0 μM) showing donor (green) and acceptor (red) intensities and corresponding FRET (blue). Dashed lines represent 4 distinct FRET states. c, Schematic of the VFT domain conformational sensor (left). Example single-molecule time traces of VFT domain sensor in the absence of glutamate and presence of saturating glutamate showing donor (green) and acceptor (red) intensities and corresponding FRET (blue) (bottom). smFRET population histogram of VFT domain mGluR2 sensor in the inactive (0 μM glutamate; 36 total molecules) and active (1 mM glutamate; 24 total molecules) conditions (top right). Data represent mean of N=2 independent experiments.

