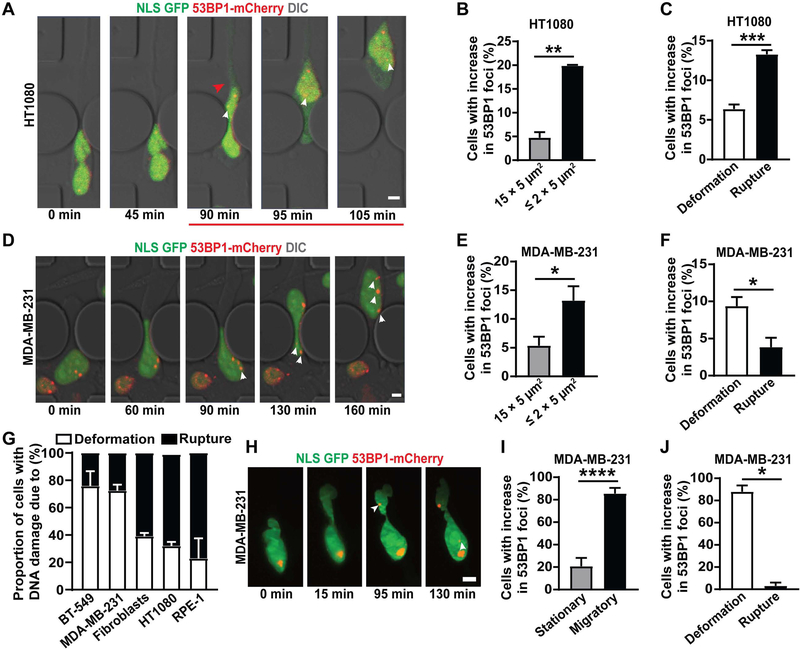
Figure 1: NE rupture and nuclear deformation lead to DNA damage during confined migration.
(A) Representative image panel showing a HT1080 fibrosarcoma cell co-expressing NLS-GFP and 53BP1-mCherry exhibiting DNA damage following NE rupture during migration through a 1 × 5 μm2 constriction in the microfluidic device. Red arrowhead indicates start of NE rupture; the red line indicates the duration of NE rupture; white arrowheads indicate newly occurring 53BP1-mCherry foci. Scale bar: 5 μm (B) Percentage of HT1080 cells with new DNA damage (53BP1-mCherry foci) during migration through small (≤ 2 × 5 μm2) constrictions (n = 372 cells) or 15 × 5 μm2 control channels (n = 268 cells). **, p < 0.01 based on unpaired t-test with Welch’s correction. (C) Percentage of HT1080 cells in which new DNA damage during migration through ≤ 2 × 5 μm2 constrictions was associated with either NE rupture or with nuclear deformation in the absence of NE rupture. n = 372 cells; ***, p < 0.001 based on unpaired t-test with Welch’s correction. (D) Representative image sequence showing a MDA-MB-231 breast cancer cell co-expressing NLS-GFP and 53BP1-mCherry experiencing new DNA damage during migration through a 2 × 5 μm2 constriction. White arrowheads indicate newly occurring 53BP1-mCherry foci. Scale bar: 5 μm (E) Percentage of MDA-MB-231 cells with new DNA damage (53BP1-mCherry foci) during migration through small (≤ 2 × 5 μm2) constrictions (n = 381 cells) or 15 × 5 μm2 control channels (n = 196 cells). *, p < 0.05 based on unpaired t-test with Welch’s correction. (F) Percentage of MDA-MB-231 cells in which new DNA damage during migration through ≤ 2 × 5 μm2 constrictions was associated with either NE rupture or with nuclear deformation in the absence of NE rupture. *, p < 0.05 based on unpaired t-test with Welch’s correction. (G) Association of new DNA damage incurred during migration through ≤ 2 × 5 μm2 constrictions with either NE rupture (Rupture) or nuclear deformation without NE rupture (Deformation), for a panel of cell lines. The results correspond to the data presented in Figure 1C and 1F, and Figure S1G–I. (H) Representative image sequence of a MDA-MB-231 cell co-expressing NLS-GFP and 53BP1-mCherry incurring DNA damage during migration in a dense (1.7 mg/ml) collagen matrix. White arrowheads indicate newly occurring 53BP1-mCherry foci. Scale bar: 5 μm (I) Percentage of MDA-MB-231 cells with new DNA damage (53BP1-mCherry foci), comparing cells that migrate (n = 48 cells) with those that remain stationary (n = 29 cells) in a collagen matrix (1.7 mg/ml). *, p < 0.0001 based on Fisher’s test. (J) Percentage of MDA-MB-231 cells in which new DNA damage during migration through a collagen matrix was associated with either NE rupture or with nuclear deformation in the absence of NE rupture. n = 33 cells, *, p < 0.05 based on Chi-square test. Data in this figure are presented as mean + S.E.M. See also Videos S1–S3, Figure S1, S2 and S4.

