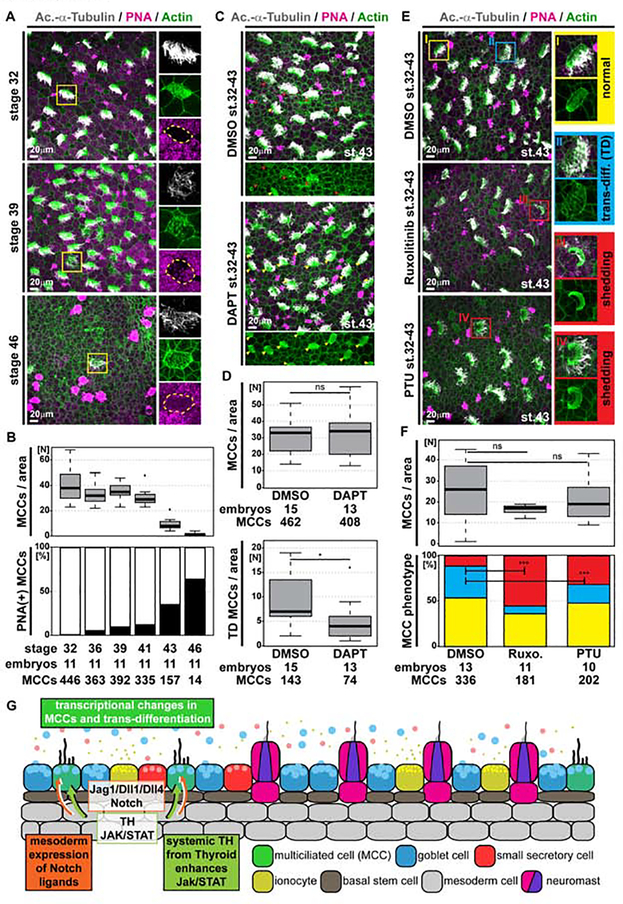
Figure 3. Global loss of MCCs through trans-differentiation into Goblet cells is regulated by Notch, Jak/STAT and Thyroid hormone signaling.
(A,C,E) Confocal micrographs of the epidermis stained for MCCs (Ac.-α-Tubulin, grey), F-actin (Actin, green) and mucus (PNA staining, magenta). (A) Analysis of samples from stage 32 to 46 reveals MCCs with altered apical F-actin morphology, which stain positive for mucus, indicating MCC trans-differentiation into Goblet cells. Magnified MCCs are indicated by yellow boxes. N = 11 embryos per stage. (B) Quantification of total MCC numbers and proportion of PNA(+) MCCs between stage 32 and 46. (C) Notch inhibition by DAPT treatment reduces the number of MCCs showing signs of trans-differentiation (red arrowheads). Normal MCCs indicated by yellow arrowheads. DMSO N = 15; DAPT N = 13 embryos. (D) Quantification of total MCC numbers and number of MCCs showing trans-differentiation (TD) morphology. Mann Whitney test, ns P > 0.05 = not significant, * P < 0.05. (E) Inhibition of Jak1/2 signaling by Ruxolitinib (Ruxo.) or inhibition of Thyroid hormone signaling by Propylthiouracil (PTU) decreases the number of MCCs showing signs of trans-differentiation (TD, blue box) and increases the number of MCCs with apoptotic/shedding morphology (red boxes). Normal MCC indicated by yellow box. DMSO N = 13; Ruxolitinib N = 11; PTU N = 10 embryos. (F) Quantification of total MCC numbers (upper panel; Mann Whitney test, ns P > 0.05 = not significant) and proportions of normal (yellow), trans-differentiating (blue), apoptotic/shedding (red) MCC phenotypes (lower panel; χ2 test, *** P < 0.001). (G) Schematic representation of mesoderm induced MCC trans-differentiation.

