
Figure 1.
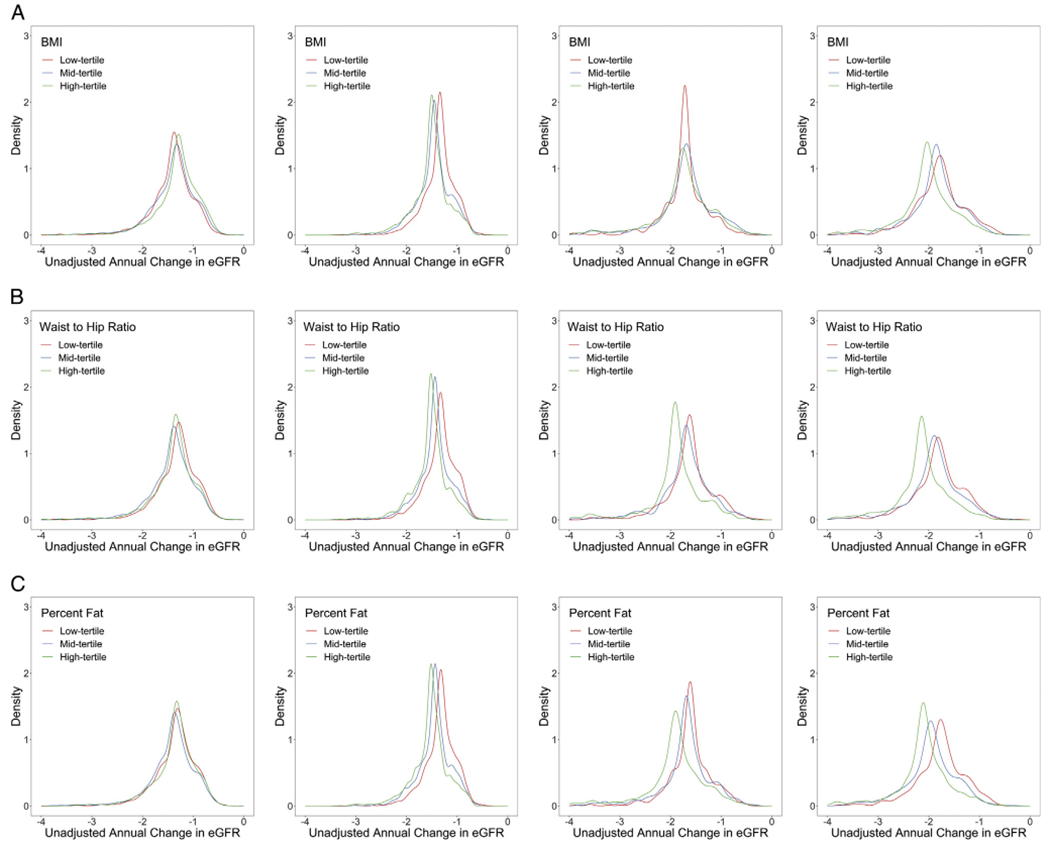
Distribution of unadjusted predicted average annual change in estimated glomerular filtration rate (eGFR; mL/min/1.73 m2) within the Atherosclerosis Risk in Communities (ARIC) population according to baseline obesity marker tertile by sex and race. (A) Annual eGFR change according to body mass index (BMI) tertile among (left to right) White men, White women, Black men, and Black women. (B) Annual eGFR change according to waist-to-hip ratio tertile among (left to right) White men, White women, Black men, and Black women. (C) Annual eGFR change according to baseline predicted percent fat tertile among (left to right) White men, White women, Black men, and Black women.