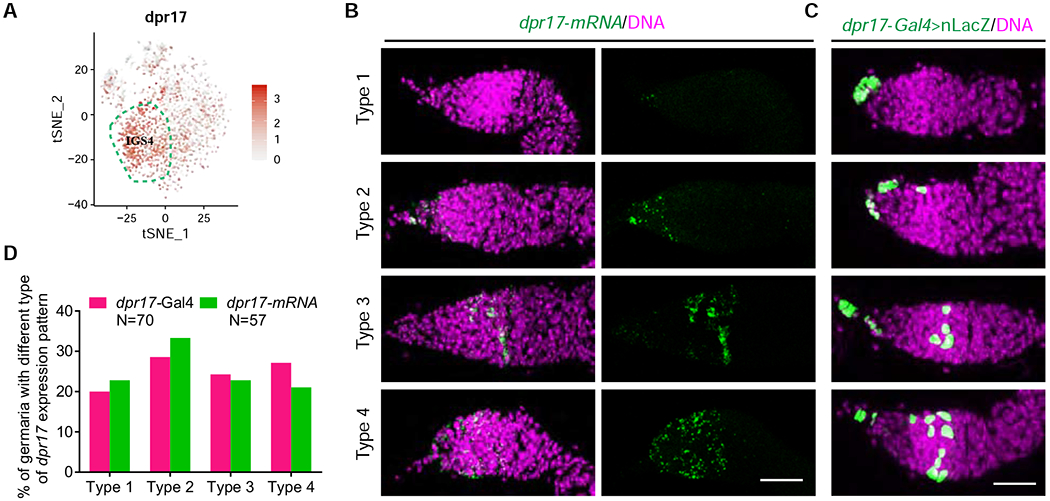
Figure 3. dpr17 is dynamically expressed in different IGS subpopulations.

(A) t-SNE plot showing dpr17 is enriched in the IGS4 (highlighted by broken lines) and is also expressed in other IGS subpopulations at low levels.
(B-C) dpr17 mRNA FISH (B) images and dpr17-Gal4>UAS-nLacZ expression patterns (C) showing variable expression patterns of dpr17 in Drosophila germaria. Scale bars, 20 μm.
(D) Quantification results of dpr17-Gal4 and dpr17 mRNA expression patterns.
