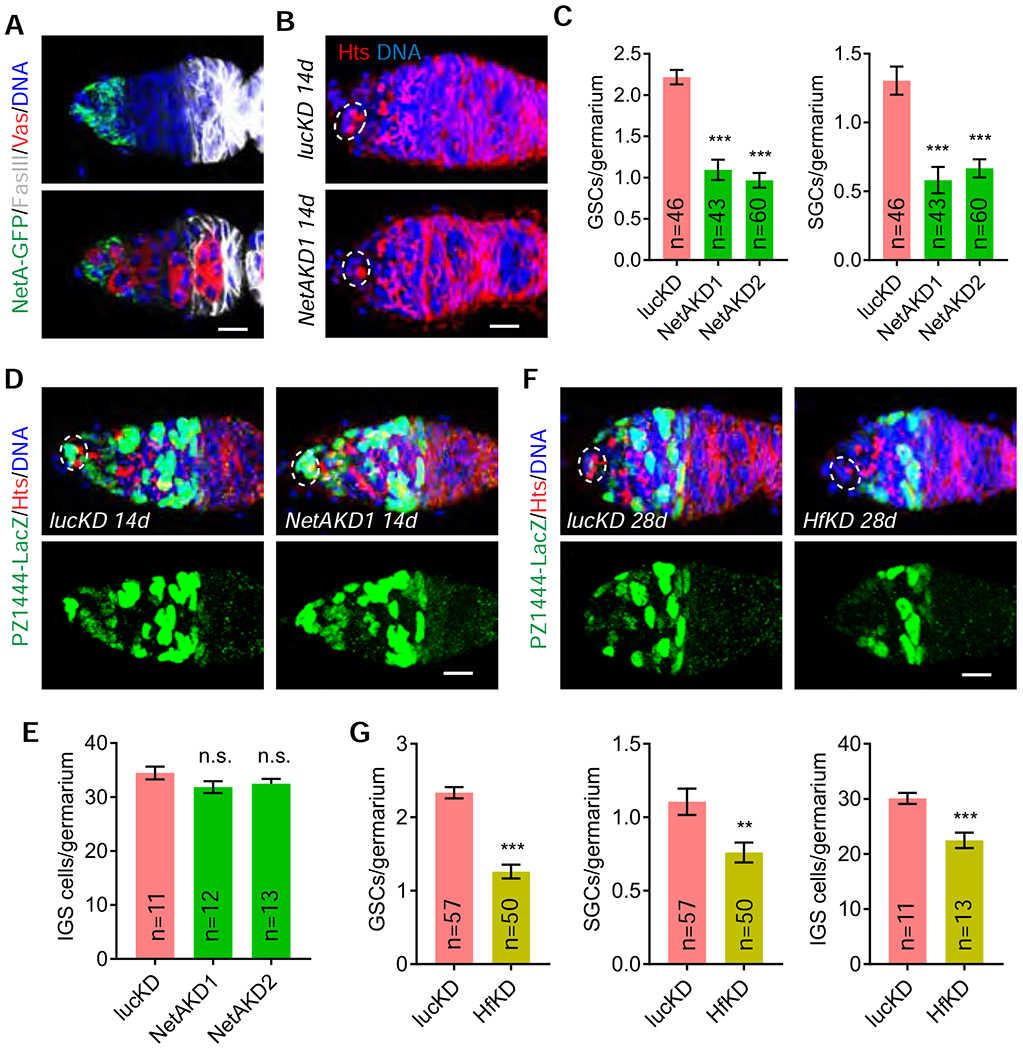
Figure 6. Anterior IGS-enriched NetA and Hf are required for maintaining GSCs.

Cap cells and GSCs are highlighted by broken ovals.
(A) Confocal images showing high expression of NetA-GFP in IGS1 and its weak expression in IGS2. Scale bars, 10 μm.
(B-C) c587ts-driven NetA knockdown decreases GSCs and SGCs (C: quantification results; n = No. of germaria). Scale bars, 10 μm. (Student’s t-test: ***, P ≤ 0.001).
(D-E) c587ts-driven NetA knockdown does not significantly affect IGS cells (E: quantification results; n = No. of germaria). Scale bars, 10 μm. (Student’s t-test: n.s., no significance)
(F-G) c587ts-driven Hf knockdown decreases GSCs, SGCs and IGS cells (E: quantification results; n = No. of germaria). Scale bars, 10 μm. (Student’s t-test: ***, P ≤ 0.001; **, P ≤ 0.01). Scale bars, 10 μm.
See also Figure S6.
