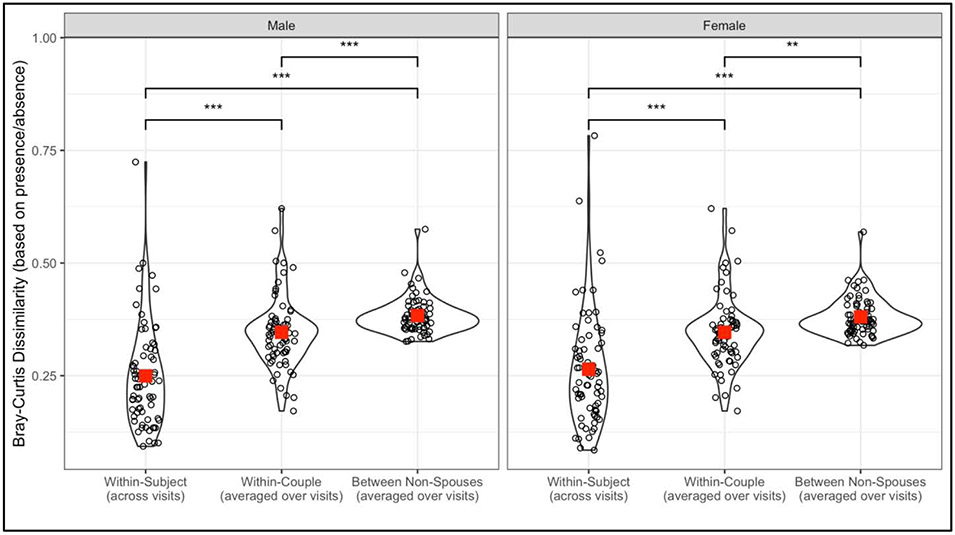
Figure 1:
Bray-Curtis distances using presence/absence data to quantify beta diversity within-subject/between-visit, within-couple (distance averaged over visits), and between individuals and all other same-sex individuals who were not the spouse (averaged over other individuals and over visit). Smaller Bray-Curtis distance corresponds to higher similarity. Large square is the group mean. ***p<0.001

