Figure 1.

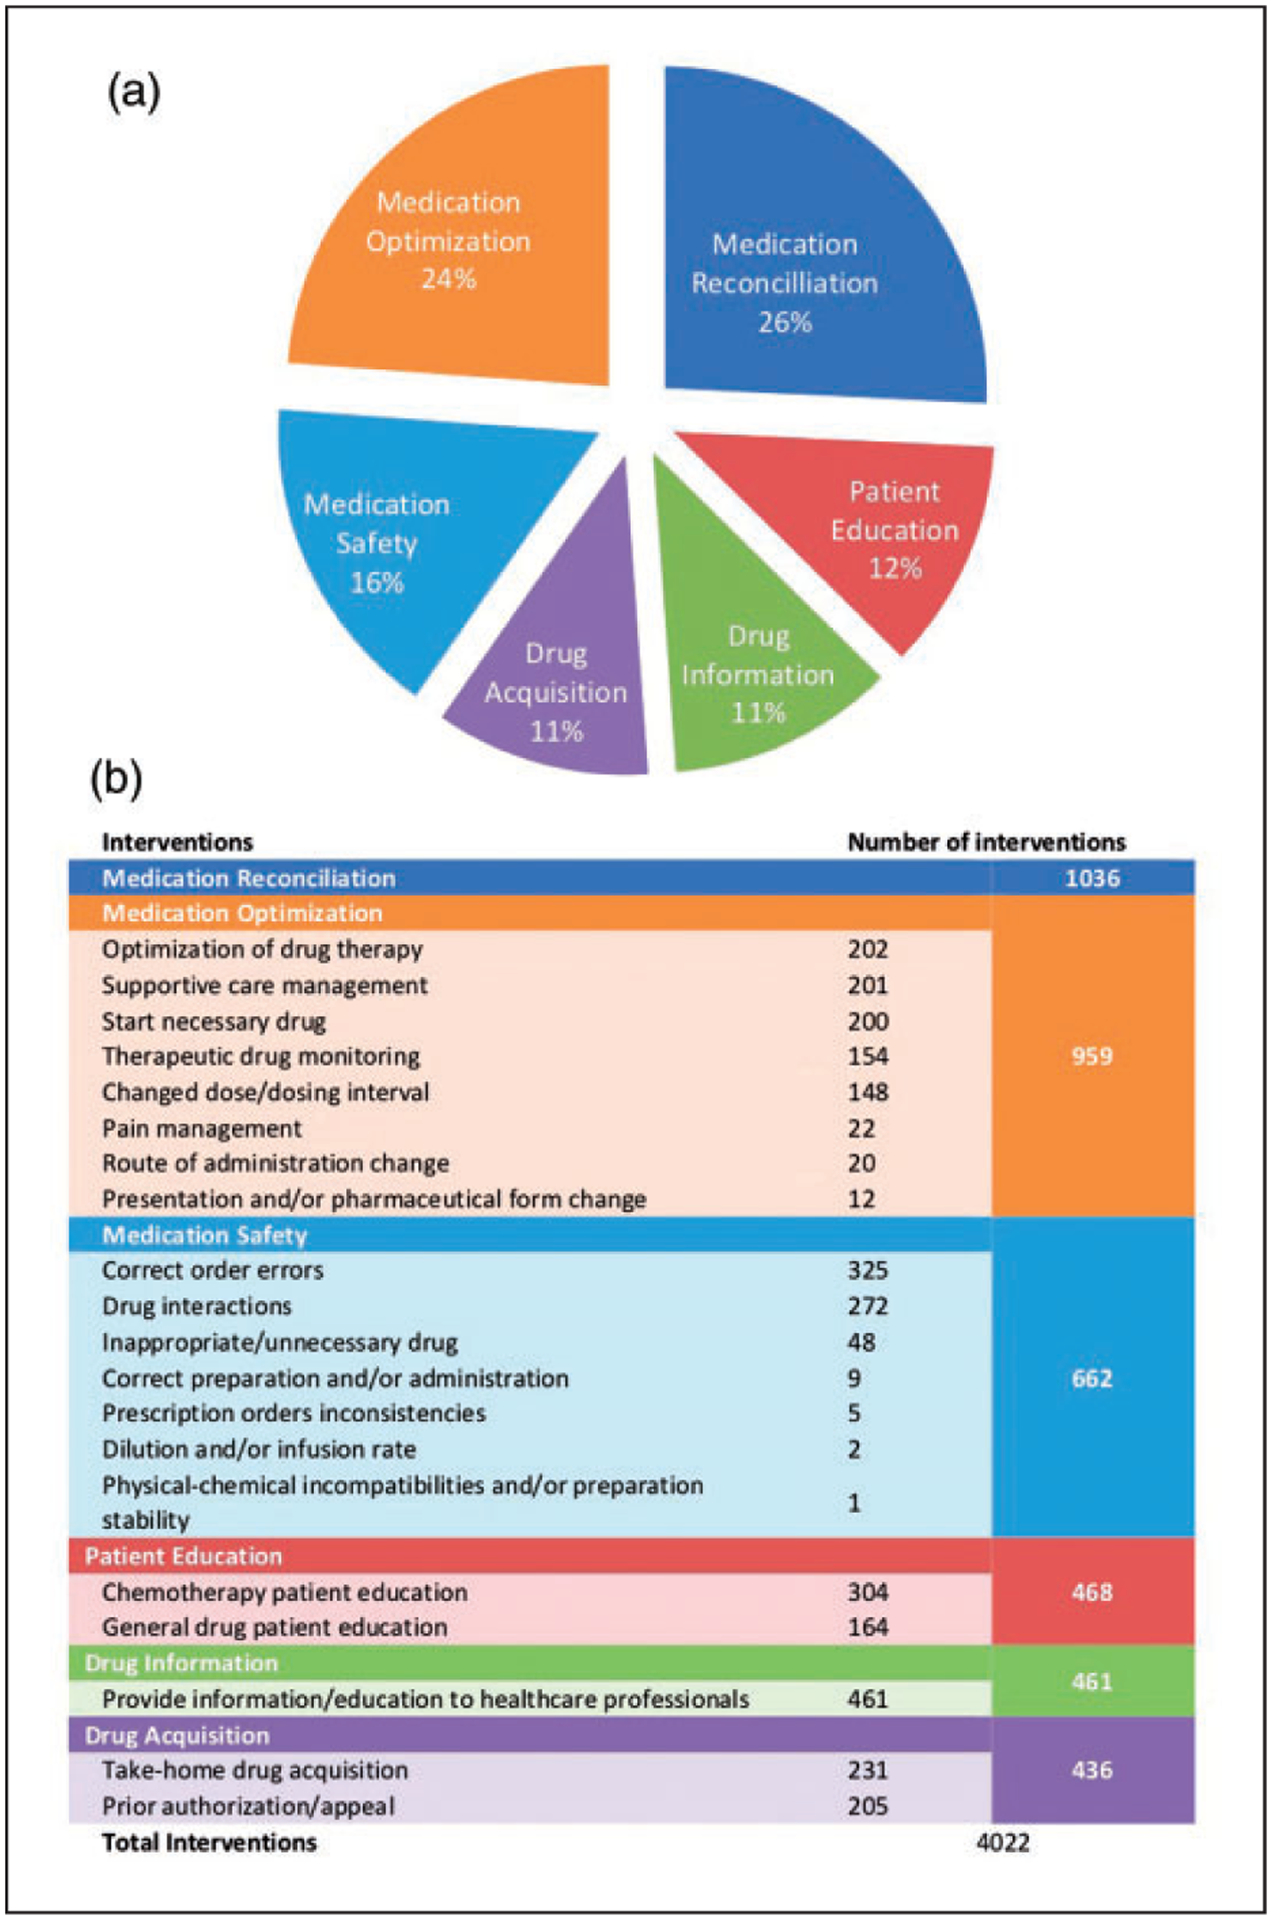
Summary of Outpatient Clinical Interventions. (a). The pie chart shows the distribution of interventions in 6 different categories. (b). Number of interventions in each subcategory.

Summary of Outpatient Clinical Interventions. (a). The pie chart shows the distribution of interventions in 6 different categories. (b). Number of interventions in each subcategory.