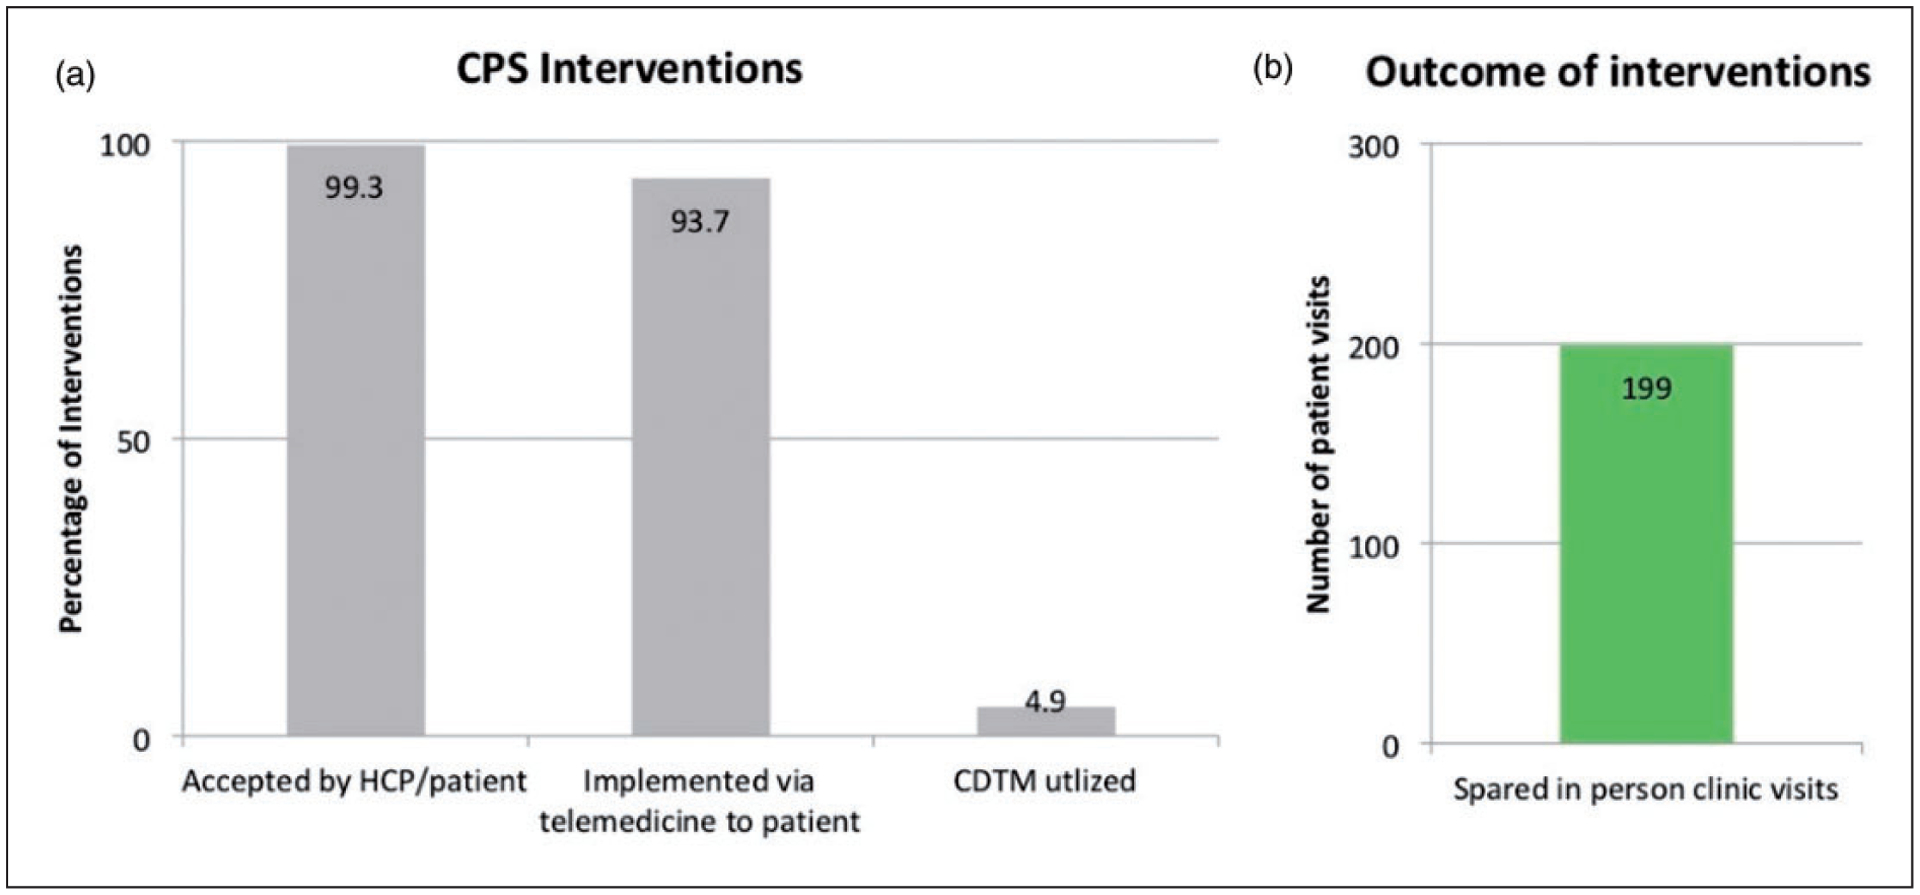
Figure 2.

The Impact of CPS Interventions on COVID-19 Related Outcomes. (a). The bar graph represents the percentages of intervention accepted by HCP/patient, implemented via telemedicine to the patient directly, and involved CDTM. (b). The bar graph shows the number of in-person visits spared by CPS interventions.
