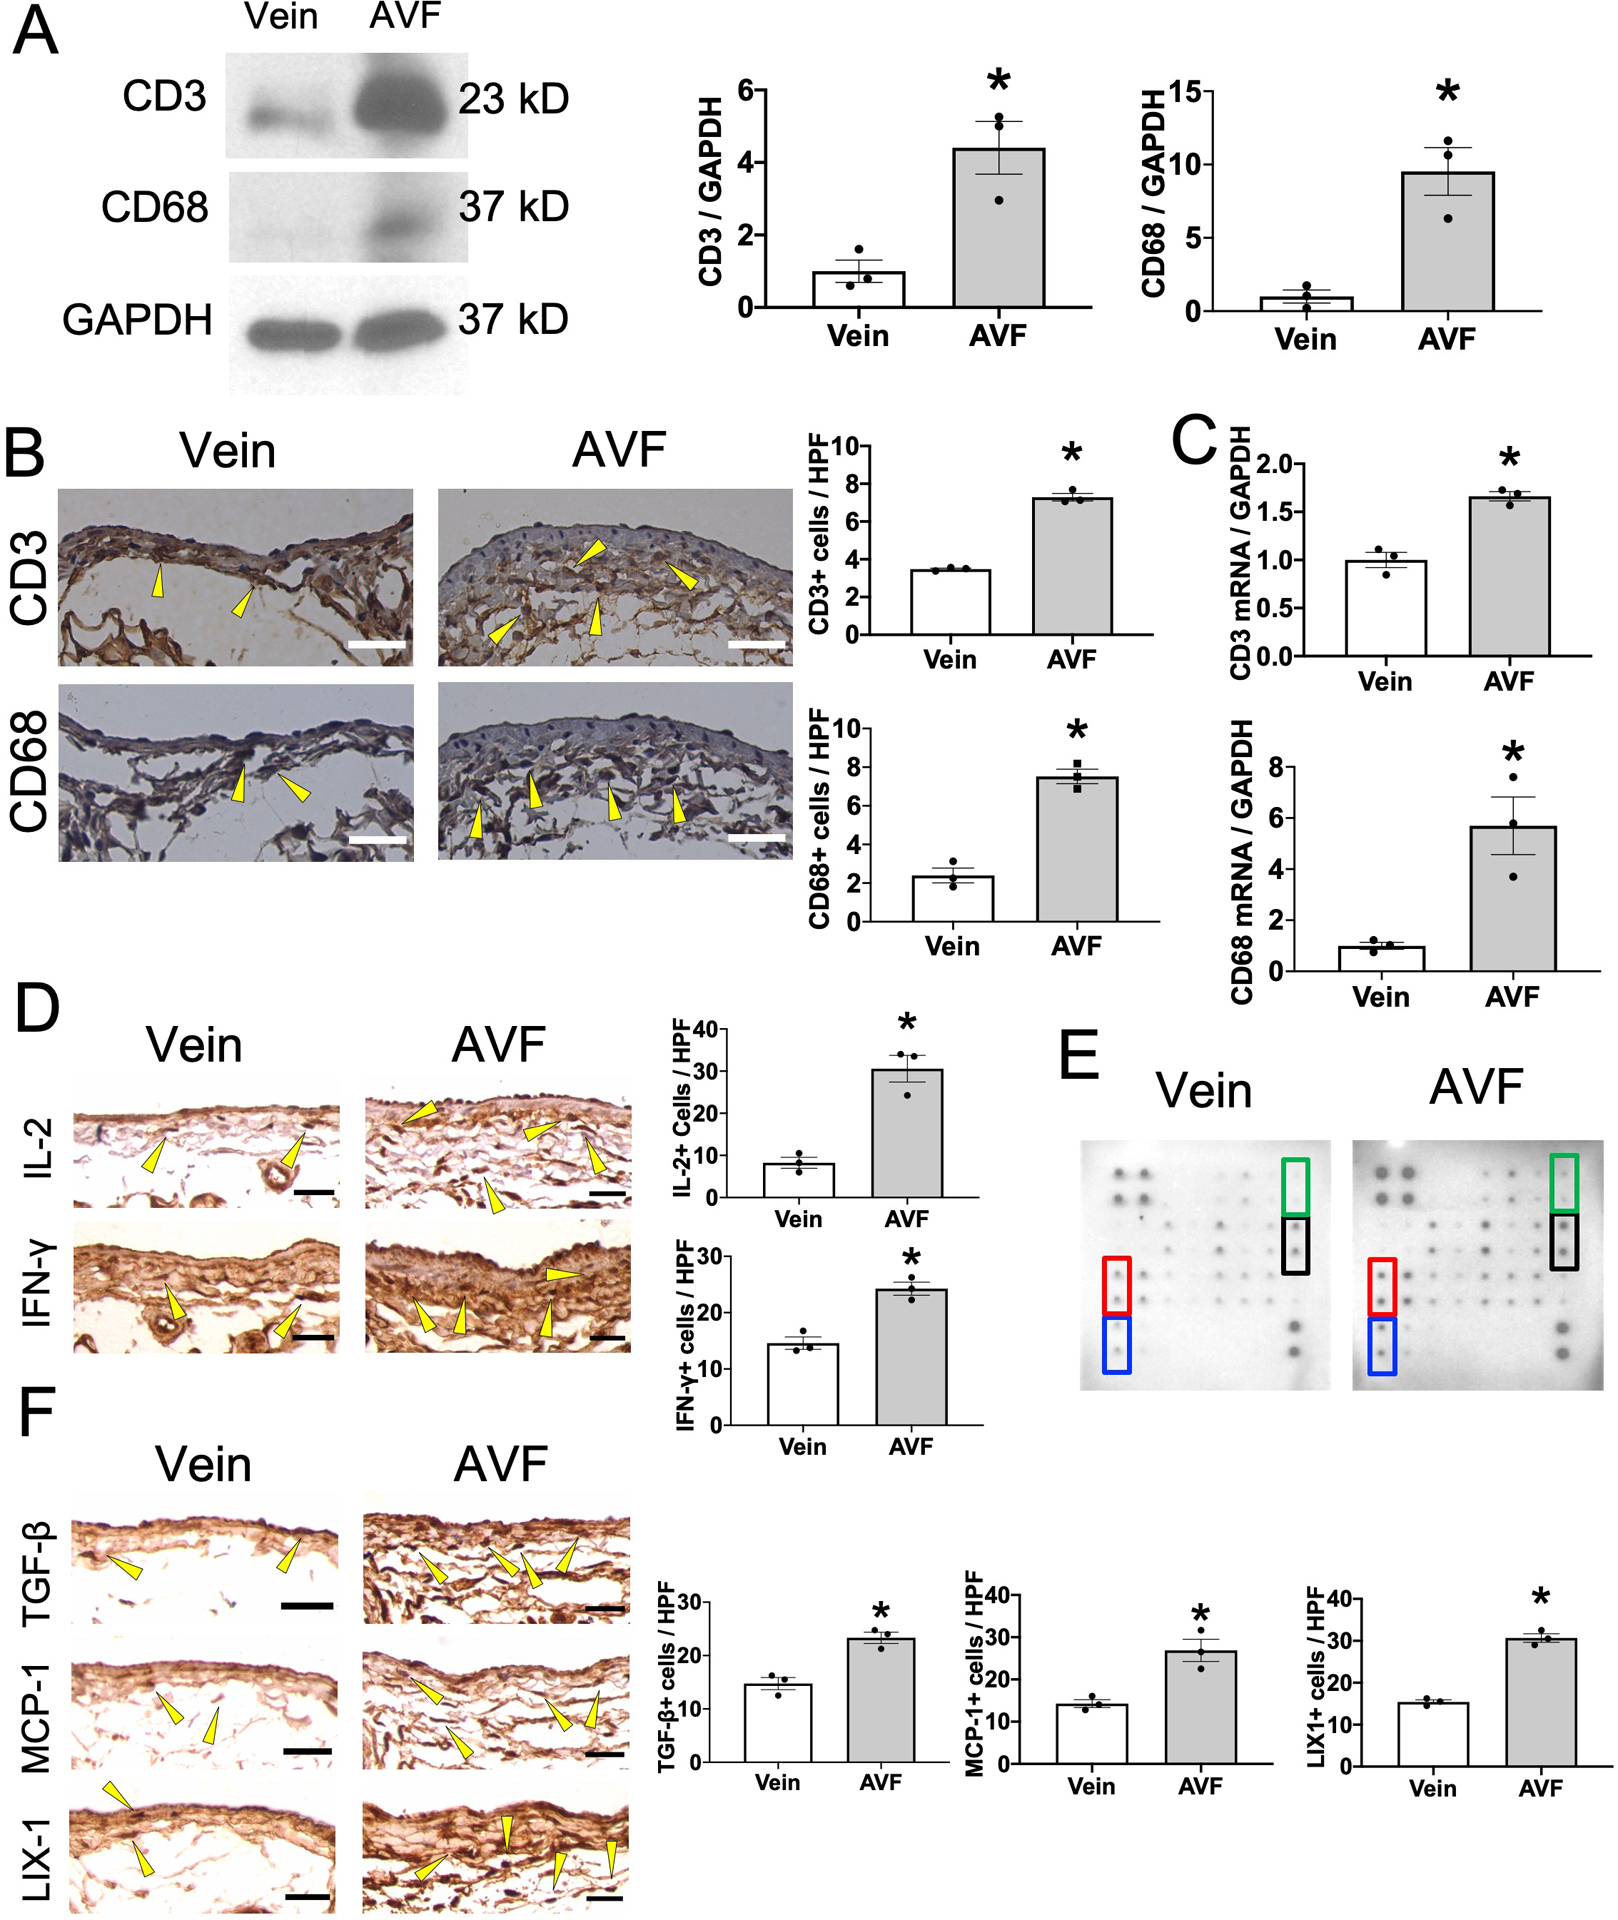
Figure 1. T-cells and macrophages accumulate in the AVF during venous remodeling in wild type mice.

(A) Representative Western blot analysis of CD3, CD68 and GAPDH immunoreactivity in control vein or AVF (day 7). Bar graph shows relative densitometry of CD3 (n=3, *P=0.0126 (t-test), P=0.1000 (Mann-Whitney U test)) and CD68 (n=3, *P=0.0072 (t-test), P=0.1000 (Mann-Whitney U test)). (B) Representative photomicrographs showing control vein or AVF (day 7) stained with anti-CD3 or anti-CD68 antibody. Scale bar, 25 μm. Arrowheads show representative CD3- or CD68-positive cells. Bar graphs show quantification of CD3+ cells (n=3, *P<0.0001 (t-test), P=0.1000 (Mann-Whitney U test)) or CD68+ cells (n=3, *P=0.0007 (t-test), P=0.1000 (Mann-Whitney U test)) in the AVF. HPF, high power field. (C) Bar graphs show relative number of CD3 (n=3, *P=0.0021 (t-test), P=0.1000 (Mann-Whitney U test)) or CD68 (n=3, *P=0.0144 (t-test), P=0.1000 (Mann-Whitney U test)) mRNA transcripts in the control vein or AVF (day 7). (D) Representative photomicrographs of control vein or AVF (day 7) stained with anti-IL-2 or anti-IFN-γ antibody. Bar graphs show quantification of IL-2+ cells (n=3, *P=0.0029 (t-test), P=0.1000 (Mann-Whitney U test)) or IFN-γ+ cells (n=3, *P=0.0037 (t-test), P=0.1000 (Mann-Whitney U test)) in IVC wall. (E) Representative photomicrographs showing the cytokine array examining lysates of control vein or AVF (day 7). Marked cytokines have significant differences between control and AVF. Red, MCP-1; blue, TGF-β; green, IFN-γ; black, LIX1. (F) Representative photomicrographs showing control vein or AVF (day 7) stained with anti-TGF-β1, anti-MCP-1 or anti-LIX antibody. Bar graphs show quantification of TGF-β+ cells (n=3, *P=0.0054 (t-test), P=0.1000 (Mann-Whitney U test)), MCP-1+ cells (n=3, *P=0.0109 (t-test), P=0.1000 (Mann-Whitney U test)) or LIX1+ cells (n=3, *P=0.0002 (t-test), P=0.1000 (Mann-Whitney U test)) in the control vein or AVF.
