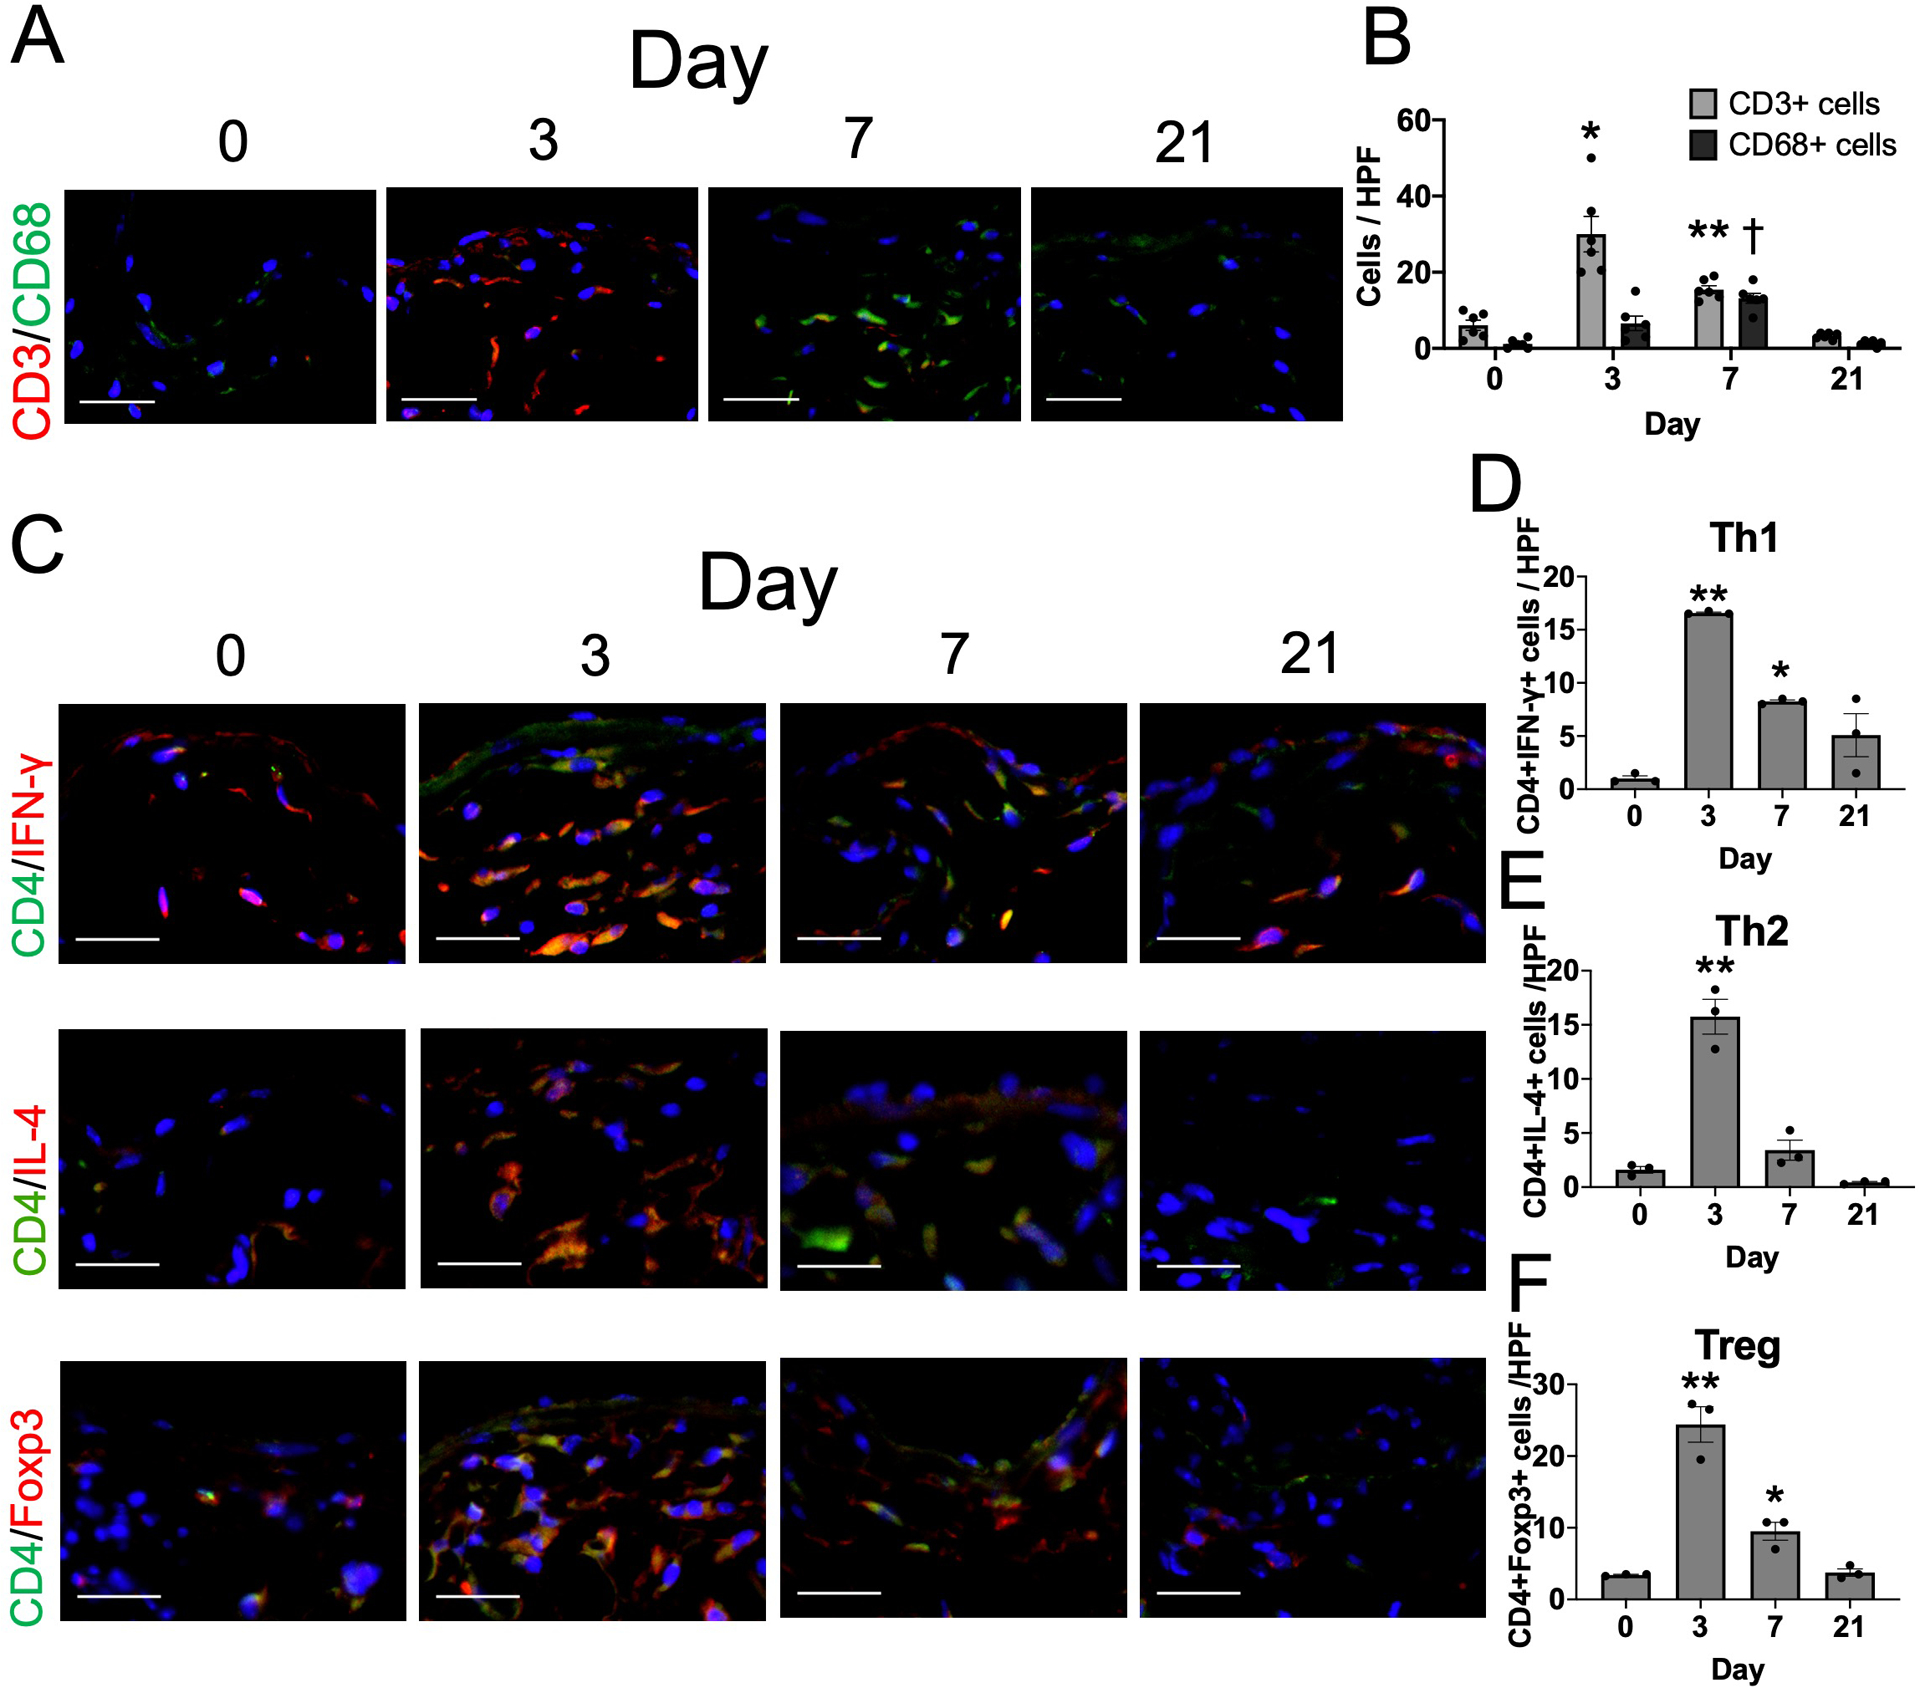
Figure 2. T-cells precede macrophages in the remodeling venous wall in wild type mice.

(A) Representative photomicrographs showing CD3 (red) and CD68 (green) in the AVF wall at days 0, 3, 7 or 21. Scale bar, 50 μm. (B) Bar graph shows quantification of CD3- or CD68-positive cells in the AVF at day 0, 3, 7 or 21. n=6. P<0.0001 (2-way ANOVA); *P=0.0076 (day 3 vs day 0, post hoc). **P=0.0002 (day 7 vs day 0, post hoc). †P=0.0003 (day 7 vs day 0, post hoc). (C) Representative photomicrographs showing CD4 (green) and IFN-γ (red), CD4 (green) and IL-4 (red) or CD4 (green) and Foxp3 (red) in the AVF wall at days 0, 3, 7 or 21. Scale bar, 50 μm. (D) Bar graph shows quantification of CD4+IFN-γ+ cells in the AVF at day 0, 3, 7 or 21. n=3. P<0.0001 (ANOVA), P=0.0017 (Kruskal-Wallis); **P<0.0001 (day 3 vs day 0, post hoc). *P=0.0027 (day 7 vs day 0, post hoc). (E) Bar graph shows quantification of CD4+IL-4+ cells in the AVF at day 0, 3, 7 or 21. n=3. P<0.0001 (ANOVA), P<0.0001 (Kruskal-Wallis); **P<0.0001 (day 3 vs day 0, post hoc). (F) Bar graph shows quantification of CD4+Foxp3+ cells in the AVF at day 0, 3, 7 or 21. n=3. P<0.0001 (ANOVA), P=0.0012 (Kruskal-Wallis); **P<0.0001 (day 3 vs day 0, post hoc). *P=0.0386 (day 7 vs day 0, post hoc).
