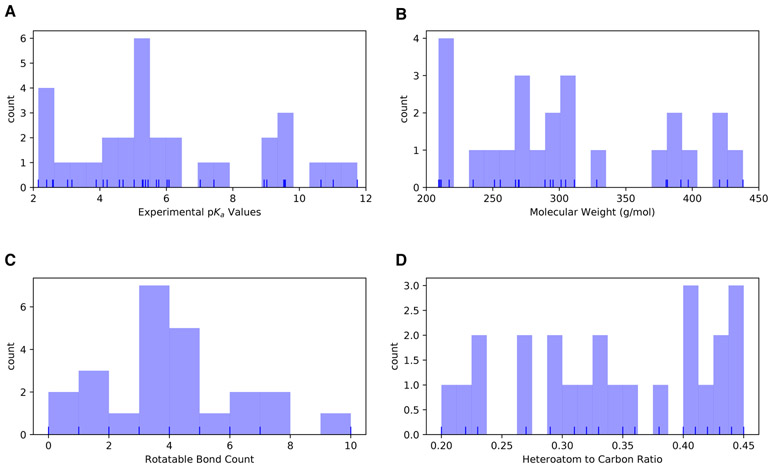
Figure 1. Distribution of molecular properties of the 24 compounds from the SAMPL6 pKa Challenge.
A Histogram of spectrophotometric pKa measurements collected with Sirius T3 [8]. The overlaid rug plot indicates the actual values. Five compounds have multiple measured pKas in the range of 2–12. B Histogram of molecular weights calculated for the neutral state of the compounds in SAMPL6 set. Molecular weights were calculated by neglecting counterions. C Histogram of the number of non-terminal rotatable bonds in each molecule. D The histogram of the ratio of heteroatom (non-carbon heavy atoms including, O, N, F, S, Cl, Br, I) count to the number of carbon atoms.

