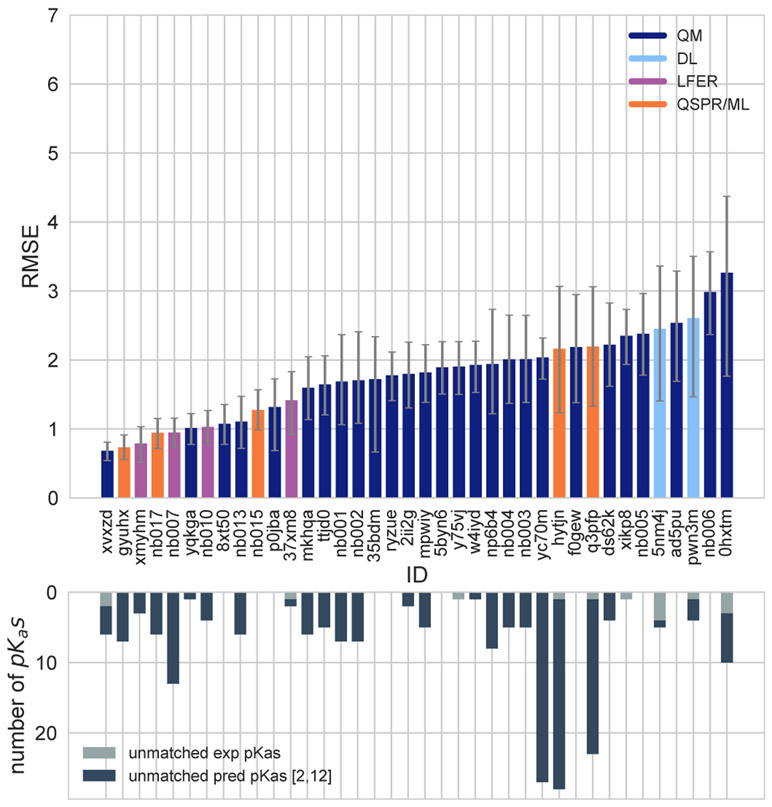
Figure 2. RMSE and unmatched pKa counts vs. submission ID plots for macroscopic pKa predictions based on Hungarian matching.
Methods are indicated by submission IDs. RMSE is shown with error bars denoting 95% confidence intervals obtained by bootstrapping over challenge molecules. Submissions are colored by their method categories. Light blue colored database lookup methods are utilized as the null prediction method. QM methods category (navy) includes pure QM, QM+LEC, and QM+MM approaches. Lower bar plots show the number of unmatched experimental pKa values (light grey, missing predictions) and the number of unmatched pKa predictions (dark grey, extra predictions) for each method between pH 2 and 12. Submission IDs are summarized in Table 1. Submission IDs of the form nb### refer to non-blinded reference methods computed after the blind challenge submission deadline. All others refer to blind, prospective predictions.

